Software
Databricks Plug-in for
Oracle Enterprise Manager
Bring Databricks workspaces, clusters, jobs, and SQL warehouses into the same OEM console you already use for Oracle. One pane of glass for your lakehouse estate.
4
Target Types
AWS · Azure · GCP
Clouds Supported
DBU
Cost Tracking
24ai
OEM Supported
Purpose-Built Dashboards
Lakehouse visibility at every level — workspace, cluster, job, and SQL warehouse — right inside Oracle Enterprise Manager.
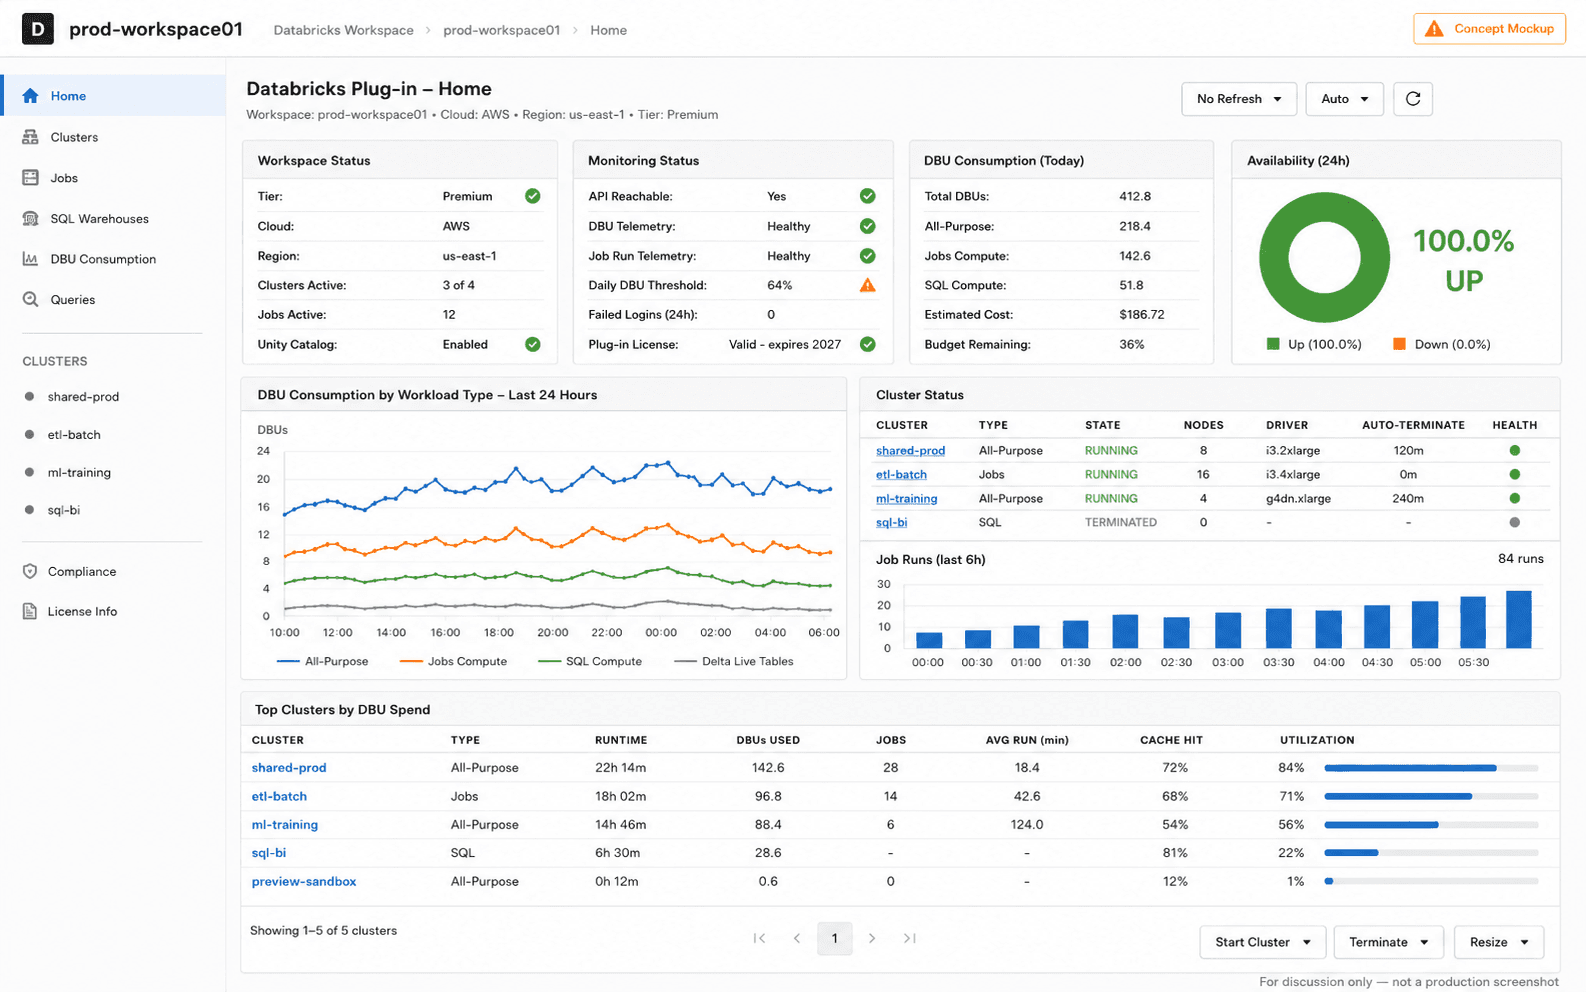
Home
Workspace rollup: active clusters, running jobs, SQL warehouse status, and DBU consumption in the current billing window, across every monitored Databricks account.
Also Included
Clusters
All-purpose and job compute clusters with node counts, driver/worker type, runtime version, uptime, auto-termination settings, and live utilization charts.
Jobs
Job run history with duration, success/failure counts, and retry behavior. Identify flaky jobs and long-tailed runs across workspaces.
SQL Warehouses
Warehouse state, cluster counts, query throughput, median and P95 latency, and queue depth. Tag hot warehouses before they stall dashboards.
DBU Consumption
DBU usage by workspace, cluster, job, and SQL warehouse with Day / Week / Month trending. Budget-aware thresholds and forecast projections.
Queries
Top SQL statements by duration, rows read, and execution count — surfaced from query history APIs across all SQL warehouses in the workspace.
Enterprise-Grade Capabilities
Go beyond workspace links. Real lakehouse observability — clusters, jobs, SQL warehouses, and cost — from inside OEM.
Workspace Topology
Auto-discovered parent/child relationships between Databricks accounts, workspaces, clusters, jobs, and SQL warehouses — rendered in the OEM Topology View.
DBU Cost Tracking
Ingest DBU consumption via the Databricks billing API, attribute cost to clusters and jobs, and alert on budget burn before invoices arrive.
Job Run Analytics
Track run duration, success rates, retries, and failure reasons over time. Alert on jobs that start missing their SLAs — not just the runs that fail outright.
SQL Warehouse Performance
Query throughput, latency percentiles, and queue depth per warehouse. Spot warehouses that need to scale up before end-user dashboards slow down.
Unity Catalog Governance Signals
Surface Unity Catalog metastore health, object counts, and privilege changes. Catch risky grants and unmanaged tables before auditors do.
Multi-Cloud & Multi-Workspace
Monitor Databricks on AWS, Azure, and GCP from the same OEM console. Each workspace is a separate target with its own API tokens.
Broad Compatibility
Enterprise-ready support across the Databricks clouds, target types, and OEM platforms you rely on.
Databricks Clouds
AWS · Azure · Google Cloud — workspace APIs 2.0 and later
Oracle Enterprise Manager
Cloud Control 24ai (24.1).
Management Agent
Linux x86-64 (primary) · Windows x86-64 · Outbound HTTPS to Databricks workspace URLs.
How It Works
Install the Plug-in
Deploy the signed OPAR artifact to your OMS and Management Agents using OEM's standard plug-in deployment flow.
Configure Targets
Add each Databricks workspace as a databricks_workspace target with its URL and a personal access token (or service-principal OAuth credentials). Clusters, jobs, and SQL warehouses are auto-discovered from that workspace.
Start Monitoring
Open the Home, Clusters, Jobs, SQL Warehouses, DBU Consumption, and Queries pages, apply the built-in compliance and cost-threshold templates, and receive alerts on budget burn and stalled jobs.
Ready to Unify Your Database Monitoring?
See how the Databricks Plug-in for Oracle Enterprise Manager brings your lakehouse estate into the same console as your relational, document, and warehouse targets.