If you spend your days running pipe between systems, you already know the truth: the hard part of observability was never the dashboards. It was getting clean, trustworthy signal out of every corner of the stack, including the corners nobody wanted to touch. Many of us have lived with that gap, where the "modern" parts of the estate are well-instrumented and everything older or stranger is a black box.
Two developments in the OpenTelemetry project this year are closing that gap from both ends. OTel is going deeper into the systems you already monitor, with profiling now a first-class signal, and wider into systems that were never on the observability map at all, like the OT and Industry 4.0 environments on the factory floor. Below we cover both: first, the new profiling signal; second, the push into industrial observability.
Part 1: Profiling, the fourth signal
In March 2026, the OpenTelemetry Profiles signal entered public Alpha. That makes profiling the fourth core signal in OTel, standing alongside traces, metrics, and logs. For anyone who has ever stared at a slow trace and asked "but why is this span slow," this is the missing piece: the signal that tells you what the CPU was actually doing.
The technical foundation is deliberately pragmatic. Profiles are built on the pprof format, and the reference collection path uses eBPF-collected stack traces gathered with very low overhead. The data flows through a Collector receiver (a pprofreceiver already exists in the contrib distribution), so profiles ride the same plumbing as your other telemetry. The real payoff is correlation: when a profile shares context with a trace, you can jump from "this request was slow" to "this function burned the time" without leaving your observability backend.

A note for the analytically minded, because it matters: Alpha means Alpha. The signal is not yet recommended for critical production workloads, and the project is targeting GA around Q3 2026. The work remaining is real: standardizing the symbolization API, settling the storage format, and sharing runtime information between in-process SDKs and eBPF agents for clean cross-signal correlation. But the direction is set, and the fourth signal is no longer theoretical.
Part 2: Industrial OpenTelemetry and the factory floor
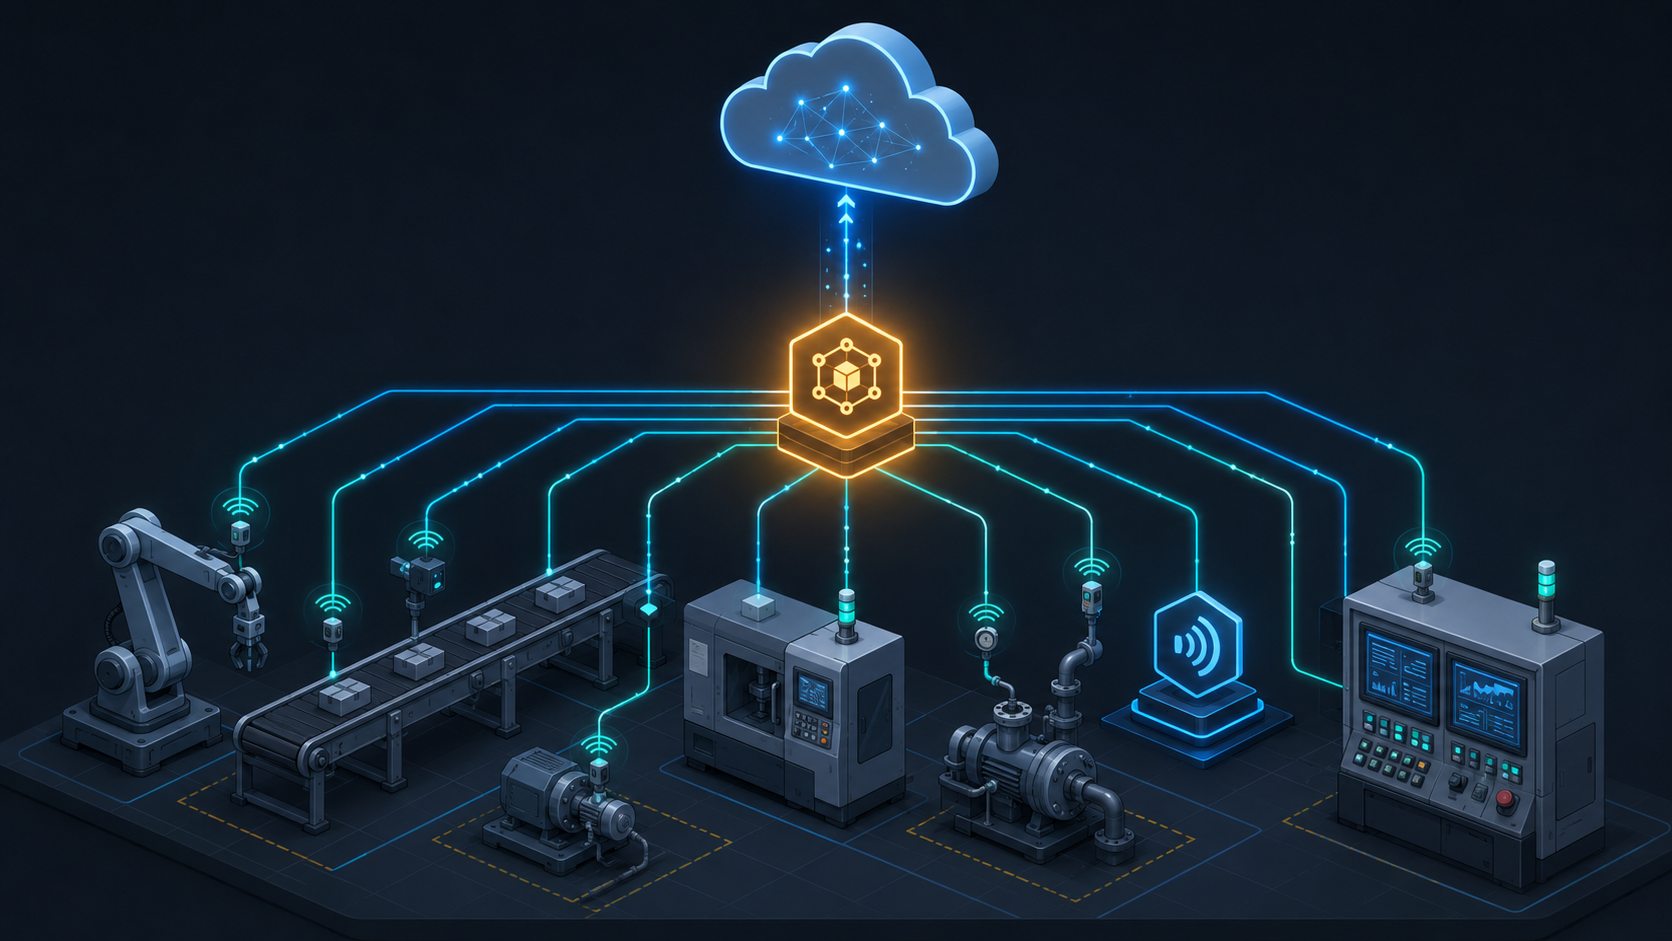
The second development points the other way: not deeper into the cloud-native stack, but outward into operational technology. Integration Plumbers are a foundational part of the growing Industrial OpenTelemetry community effort, exploring how OTel applies to OT and Industry 4.0 environments: the PLCs, sensors, robotic arms, and SCADA systems that have run for decades on their own protocols and their own rules.
This is not hand-waving. The concrete hooks already exist. Some MQTT brokers now export OTLP natively, so a production line whose robotic arms publish sensor readings to a broker can point that broker straight at a Collector's OTLP endpoint, with no custom code. Where a broker doesn't support OTLP, a lightweight bridge app can translate sensor payloads into spans and metrics. Teams are also instrumenting OPC-UA server communication to watch read/write latency, subscription throughput, and session health. The OTel project's own Demystifying OpenTelemetry post walks through turning raw, unstructured machine logs from a legacy production line into structured, queryable metrics, without changing a line of code in the legacy application.
For the people who keep these lines running, that is the whole point: the same vendor-neutral standard that already spans your IT estate can now reach the equipment on the plant floor, so IT and OT finally share one language for telemetry. This corner of the project is earlier than profiling, but it is exactly the kind of convergence worth watching.
Where this leaves us
Step back and both threads tell one story: OpenTelemetry is becoming the universal telemetry substrate, deep enough to profile a hot function and wide enough to instrument a robotic arm. The fourth signal closes the gap in code you already run; the industrial push closes the gap in systems you thought were off-limits.

For teams like ours, and like yours, that means fewer black boxes and fewer bespoke integrations to maintain. The pipes are starting to fit together. We covered the two developments we promised: profiling entering Alpha on the road to Q3 GA, and the early but practical move into industrial observability.
Frequently Asked Questions
Can I use OpenTelemetry profiling in production right now?+
Not for critical workloads yet. Profiling entered public Alpha in March 2026, which means the signal is usable and the plumbing exists (the pprof format, the eBPF collection path, and a pprofreceiver in the Collector contrib distribution), but the APIs and storage format can still change. GA is targeted for around Q3 2026. It's a great time to experiment in non-critical environments and get familiar with the workflow, but hold off on betting production incident response on it until it stabilizes.
Do I have to replace my existing traces, metrics, and logs to add profiling?+
No. Profiling is an additional signal that sits alongside the three you already have, not a replacement for any of them. Because profiles flow through the same Collector pipeline as your other telemetry, you add a receiver rather than re-architecting anything. The point of the fourth signal is to enrich what you already collect, correlating a profile with an existing slow trace, so it's designed to layer onto a working OTel deployment.
How much overhead does eBPF-based profiling actually add?+
The reference collection path was chosen specifically because eBPF gathers stack traces with very low overhead. It samples from the kernel without instrumenting or pausing your application code. Actual cost depends on sampling frequency and workload, but continuous fleet-wide profiling with eBPF is generally considered low enough to run always-on, and always-on is exactly what makes it useful. As with any sampling system, you tune frequency to balance resolution against cost.
How does OpenTelemetry reach OT systems that speak MQTT or OPC-UA instead of OTLP?+
Through a few concrete paths. Some MQTT brokers now export OTLP natively, so a broker collecting sensor readings can point straight at a Collector's OTLP endpoint with no custom code. Where a broker doesn't support OTLP, a lightweight bridge application translates sensor payloads into spans and metrics. For OPC-UA, teams instrument the server communication itself to watch read/write latency, subscription throughput, and session health. In each case you meet the equipment where it already is rather than forcing new protocols onto decades-old machines.
We run legacy production lines we can't modify. Can we still get telemetry from them?+
Often, yes, without touching the legacy application. The OpenTelemetry project's "Demystifying OpenTelemetry" walkthrough shows turning raw, unstructured machine logs from a legacy line into structured, queryable metrics, with no code change to the application producing them. That log-to-metric path, combined with broker-level and protocol-level instrumentation, means a lot of "untouchable" equipment can still contribute signal to a unified observability backend.
How do we get involved or start adopting these capabilities?+
Both efforts are open in the OpenTelemetry community. For profiling, the fastest start is standing up the pprofreceiver in a test Collector and correlating profiles against traces you already collect. For industrial observability, the Industrial OpenTelemetry effort is actively exploring patterns for OT and Industry 4.0 environments. If you'd like help mapping either to your own estate, that's exactly the kind of work we do. See the consultation link below.
Let's close the last gaps together
Both the profiling signal and the Industrial OpenTelemetry effort are open in the community, and we'd love to compare notes on what you're instrumenting next.
If you'd like to talk through how either one could fit your environment, we're happy to help.
Schedule a consultation with our team →
Sources: OpenTelemetry Profiles Enters Public Alpha · Demystifying OpenTelemetry: Observability in Traditional Environments · OpenTelemetry Profiles signal docs · CNCF: OpenTelemetry Graduation