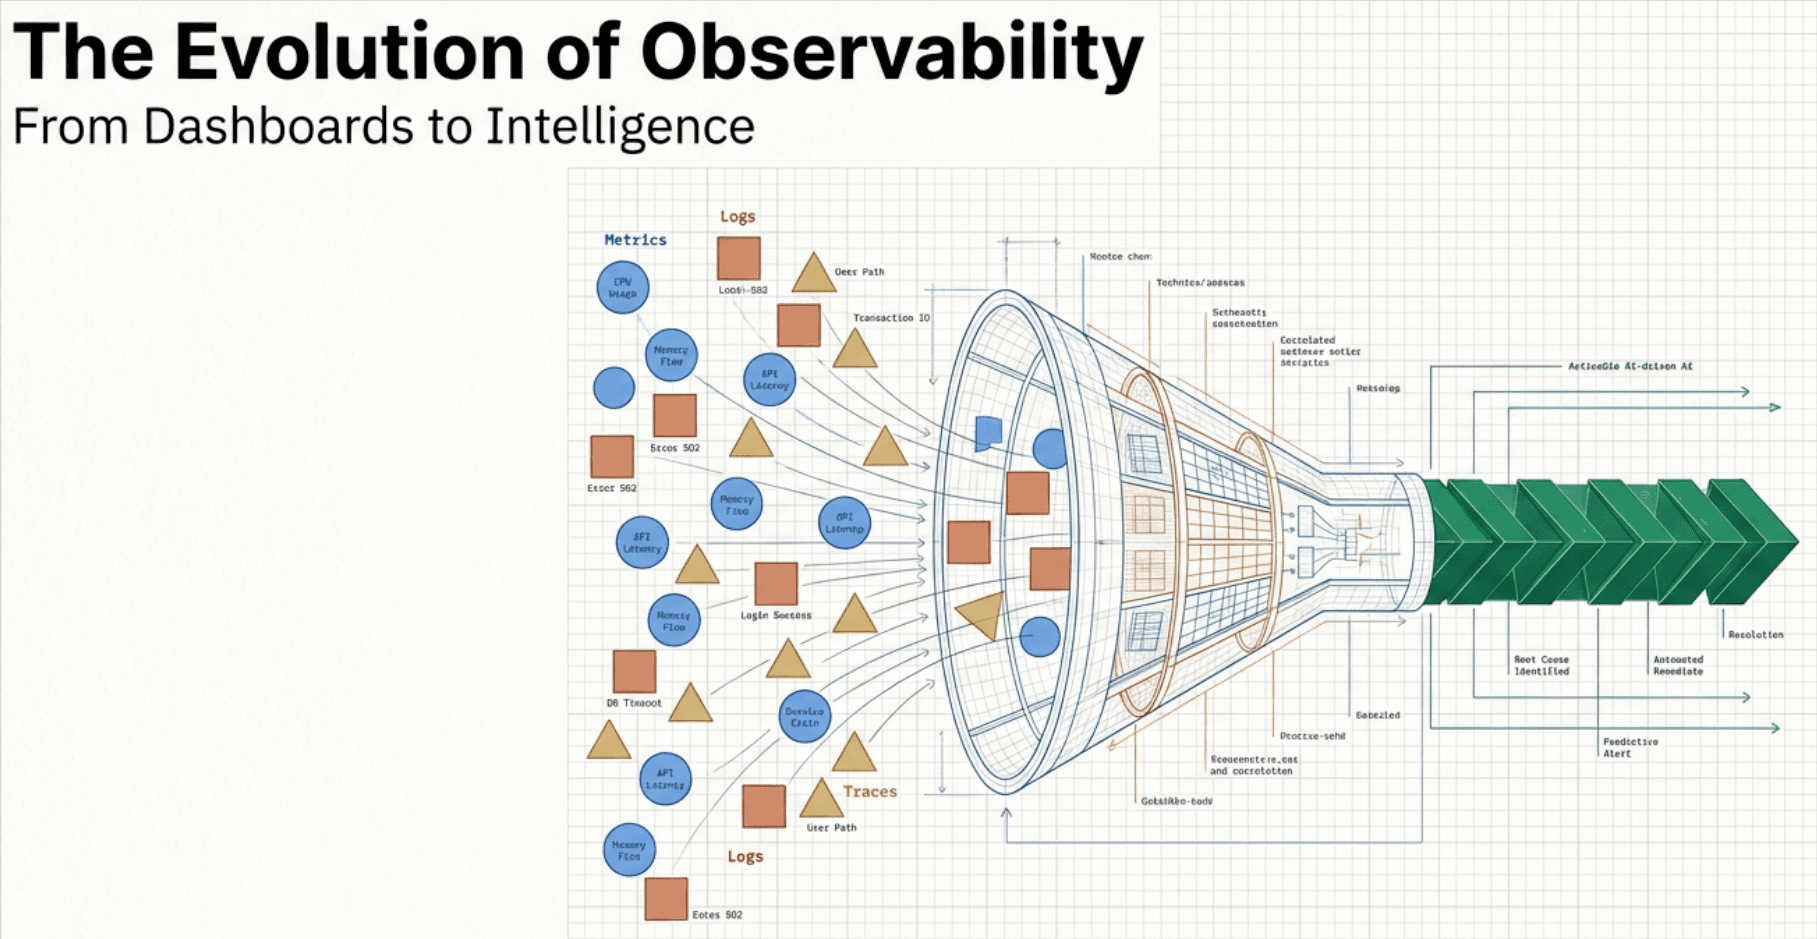
Introduction: The Sticker Shock Moment
You've done everything right. Your team has migrated from proprietary agents to OpenTelemetry. The instrumentation is working beautifully—traces are flowing, metrics are populating dashboards, and your SREs are finally getting the visibility they've been asking for. Then the bill arrives.
The problem isn't volume—it's high cardinality. Unique combinations of attribute values create exponential growth in your metric streams, bloating storage, slowing queries, and driving up costs far beyond what you budgeted.
High cardinality isn't just about how much data you're collecting—it's about how diverse that data is.
Key Terms
Cardinality: The number of unique values or combinations in a dataset. High cardinality means millions of unique values; low cardinality means a small, predictable set.
OpenTelemetry Collector: A vendor-agnostic data pipeline that receives, processes, and exports telemetry data (metrics, traces, logs).
Metric Stream: A unique time-series created by a distinct combination of metric name and label values in time-series databases like Prometheus.
Semantic Conventions: Standardized attribute naming patterns defined by the OpenTelemetry project to ensure consistency across implementations.
Transform Processor: An OTel Collector component that modifies telemetry data in-flight, such as dropping attributes or aggregating values.
What is Cardinality? (The LEGO Analogy)
Think of cardinality as the number of unique combinations your data can produce. To make this concrete, let's use a LEGO analogy.
Low Cardinality: The LEGO Kit
Imagine a LEGO kit with specific, numbered bags and clear instructions. Every piece has a defined place. That's what low-cardinality data looks like—structured, predictable, and easy to manage.
order_status = ["pending", "processing", "shipped", "delivered", "cancelled"]
# Only 5 possible values across millions of orders
High Cardinality: The Mixed LEGO Pile
Now imagine dumping ten different LEGO sets into one giant pile with no instructions. Every piece is unique, and finding anything specific becomes overwhelming. That's high-cardinality data—millions of unique values with no natural grouping.
order_id = "ORD-8f4e3a21-9b7c-4d1e-a5f6-2c8b9e3d7a1f"
user_id  = "USR-7c2d8e9f-3a1b-4c5e-9f6a-8d2e3b7c1a4f"
container_id = "k8s-pod-checkout-svc-7f9d8c3e2b1a-5g6h7"
# Millions of unique values across millions of requests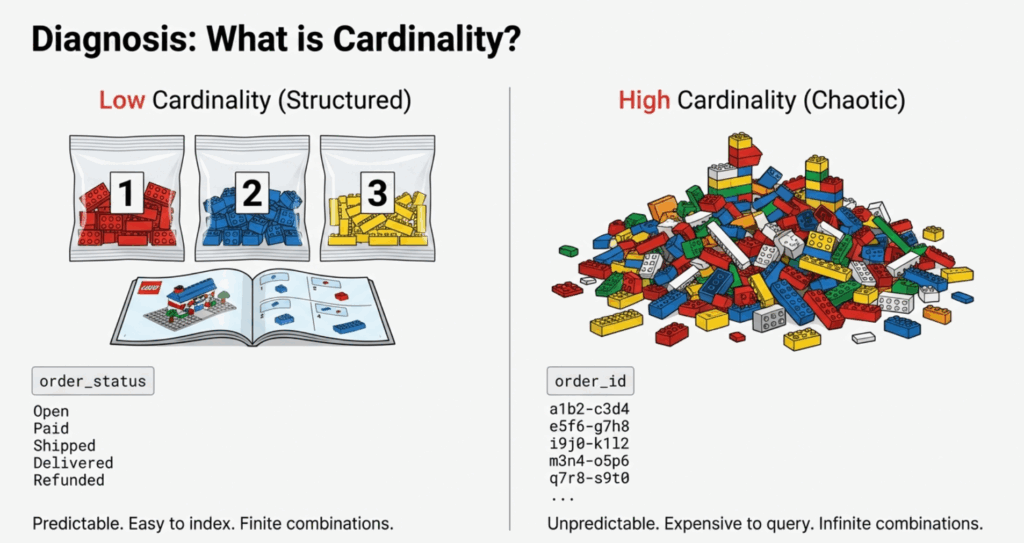
The Technical Impact
Here's where it gets expensive. Time-series databases like Prometheus create a unique metric stream for each distinct combination of label values. Consider a simple HTTP request duration metric:
- 5 HTTP methods x 20 endpoints x 1,000,000 unique order IDs per day = 100,000,000 streams (not 100)
Each of those streams requires:
- Index space in memory
- Storage for time-series data points
- Computation overhead for queries that must scan millions of streams
Case Study: The "SparkPlug Motors" Mistake
Let's make this real with a fictional (but very common) story.
The Scenario
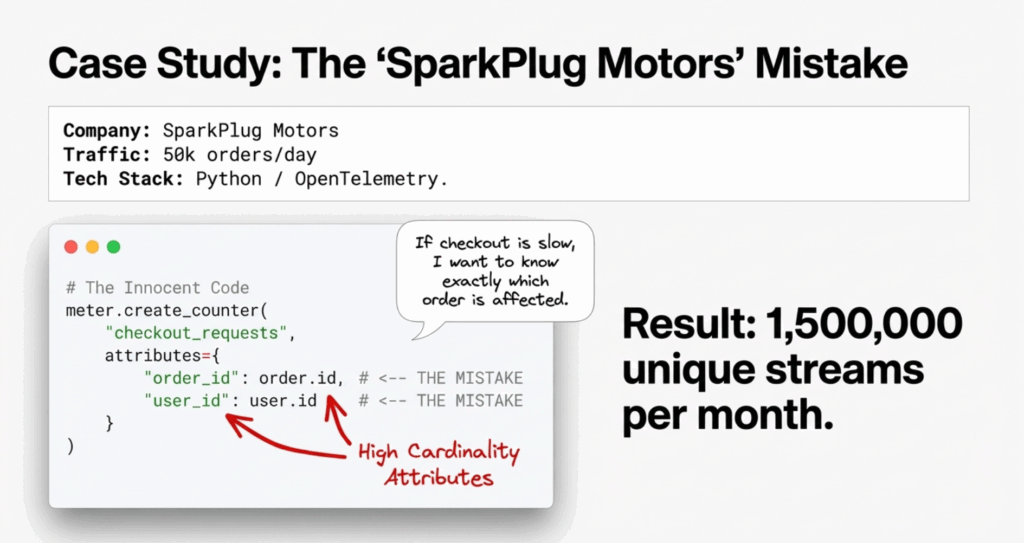
SparkPlug Motors is a mid-size auto parts e-commerce company. They recently adopted OpenTelemetry for their checkout service. A well-intentioned developer added detailed attributes to track checkout performance:
from opentelemetry import metrics
from opentelemetry.sdk.metrics import MeterProvider
from opentelemetry.sdk.metrics.export import PeriodicExportingMetricReader

meter = metrics.get_meter(__name__)
checkout_latency = meter.create_histogram(
    name="checkout.duration",
    description="Time to process checkout",
    unit="ms"
)

def process_checkout(order_id, user_id, items):
    start_time = time.time()
    result = perform_checkout(order_id, user_id, items)
    duration = (time.time() - start_time) * 1000

    # THE MISTAKE: Adding unique IDs as attributes
    checkout_latency.record(
        duration,
        attributes={
            "order_id": order_id,        # UNIQUE per request
            "user_id": user_id,           # UNIQUE per user
            "order_status": result.status # LOW cardinality (5 values)
        }
    )

    return result
The Mistake Analysis
The developer's reasoning was sound: "We might want to filter checkout latency by specific orders or users." But the implementation was fatally flawed.
Here's the cardinality math:
- SparkPlug processes ~50,000 orders per day
- ~10,000 active users per day
- 30-day metric retention
Instead of creating ~5 metric streams (one per order status), they created ~1,500,000 unique streams per month, each with 1,440 data points per day at 1-minute resolution.
The Consequence
Within two weeks:
- Prometheus memory usage spiked 600%, causing OOM-kills on their monitoring infrastructure
- Grafana dashboards timed out when trying to visualize P95 checkout latency
- Monthly observability costs jumped from $2K to $10K as their vendor charged per active time series
- SRE team couldn't use the data because aggregation queries were too slow during incidents
The irony? Nobody actually queried checkout latency by order_id. The attribute was never used for its intended purpose.
Strategy 1: Centralize Complexity in the Collector
The first and most impactful strategy is using the OpenTelemetry Collector as a centralized data refinery. Instead of modifying every application, you process and transform telemetry data at a single control point.
The OTel Collector acts as a pipeline sitting between your applications and backends. Platform teams can configure processors to enforce governance policies—stripping high-cardinality attributes, standardizing names, and routing data to appropriate destinations.
Here's how SparkPlug fixed their problem:
receivers:
  otlp:
    protocols:
      grpc:
        endpoint: 0.0.0.0:4317
      http:
        endpoint: 0.0.0.0:4318

processors:
  # Drop high-cardinality attributes from metrics
  transform/drop_high_cardinality:
    error_mode: ignore
    metric_statements:
      - context: datapoint
        statements:
          # Remove order_id and user_id from all metrics
          - delete_key(attributes, "order_id")
          - delete_key(attributes, "user_id")
          # Keep business-critical low-cardinality attributes
          - keep_keys(attributes, ["order_status", "payment_method", "region"])

  # Batch for efficiency
  batch:
    timeout: 10s
    send_batch_size: 1024

exporters:
  prometheus:
    endpoint: "prometheus:9090"

  # For compliance/audit, send full-fidelity data to object storage
  file:
    path: /var/log/otel/high-cardinality-archive.json

service:
  pipelines:
    metrics:
      receivers: [otlp]
      processors: [transform/drop_high_cardinality, batch]
      exporters: [prometheus]

    # Separate pipeline for archival (if needed for compliance)
    metrics/archive:
      receivers: [otlp]
      processors: [batch]
      exporters: [file]
Benefits of the Collector Approach
- No application code changes required—developers don't need to redeploy
- Centralized governance—the platform team controls what reaches the backend
- Flexibility—route high-cardinality data to cheap storage while sending aggregates to expensive backends
- Fast iteration—change processing rules without redeploying applications
Enterprise Governance Tip
Create a collector configuration library with pre-approved processor templates that teams can compose:
configs/
├── processors/
│   ├── drop-pii.yaml
│   ├── drop-high-cardinality-ids.yaml
│   ├── standardize-attributes.yaml
│   └── aggregate-to-histograms.yaml
└── pipelines/
    ├── web-services.yaml
    ├── data-pipelines.yaml
    └── infrastructure.yaml
Strategy 2: Aggregation and the "Inversion" Question
Aggregating to Histograms
The second strategy is to aggregate data at the source. Instead of recording raw latency values with unique identifiers, use histograms that automatically bucket values into meaningful ranges.
Here's the refactored SparkPlug code:
from opentelemetry import metrics

meter = metrics.get_meter(__name__)

# Histogram automatically aggregates into buckets
checkout_latency = meter.create_histogram(
    name="checkout.duration",
    description="Time to process checkout",
    unit="ms"
)

def process_checkout(order_id, user_id, items):
    start_time = time.time()
    result = perform_checkout(order_id, user_id, items)
    duration = (time.time() - start_time) * 1000

    # FIXED: Only low-cardinality attributes
    checkout_latency.record(
        duration,
        attributes={
            "order_status": result.status,      # 5 values
            "payment_method": result.payment,   # 4 values
            "region": user.region               # 3 values
        }
    )

    # High-cardinality context goes to TRACES/LOGS, not metrics
    if duration > 5000:  # Slow checkout
        logger.warning(
            "Slow checkout detected",
            extra={
                "order_id": order_id,
                "user_id": user_id,
                "duration_ms": duration,
                "trace_id": current_span.get_span_context().trace_id
            }
        )

    return result
The key change: order_id and user_id are removed from metric attributes and instead logged only when something interesting happens (slow checkout). This preserves debugging capability while eliminating cardinality explosion.
The "Inversion" Question
Most teams approach instrumentation by asking: "What data might be useful?" This leads to over-collection. Instead, invert the question: "What data would be a show-stopper if it were missing?"
Applied to SparkPlug:
- Question: Do I need to query checkout latency by
order_id30 days from now? - Reality Check: No. If a specific order is slow, you'll see it in real-time logs and traces. For trends and alerting, you need aggregate percentiles by status and region.
- Question: What if I need to debug why order #12345 was slow?
- Answer: That's a trace query, not a metrics query. Traces are designed for request-level debugging.
The Three Pillars Pattern
The key insight is that each telemetry pillar has different cardinality tolerances:
| Pillar | Cardinality Tolerance | Retention | Use Case |
|---|---|---|---|
| Metrics | LOW (hundreds to low thousands of streams) | 30-90 days | Trends, dashboards, alerting |
| Traces | MEDIUM-HIGH (sampled) | 7-15 days | Request-level debugging |
| Logs | HIGH (indexed selectively) | 7-30 days | Text search, audit trails |
order_id belongs in traces and logs, not metrics. This single insight would have prevented SparkPlug's entire cardinality crisis.
Strategy 3: Standardize with Semantic Conventions
The Wild West of Naming
When different teams name attributes differently for the same concept, you get cardinality multiplication without any new information:
# Team A (E-commerce)
attributes = {"user_id": "12345"}

# Team B (Analytics)
attributes = {"userId": "12345"}

# Team C (Mobile)
attributes = {"uid": "12345"}

# Team D (Legacy migration)
attributes = {"customer_identifier": "12345"}
These four attributes represent the same concept but create four separate dimensions in your metrics backend. Cross-team correlation becomes impossible, and your effective cardinality quadruples.
The Fix: OpenTelemetry Semantic Conventions
OpenTelemetry defines standardized attribute names for common concepts. By adopting these conventions, teams ensure consistent naming across the entire organization.
Example: HTTP Server Instrumentation
// BAD: Custom attribute names
span.SetAttributes(
    attribute.String("request_method", "POST"),
    attribute.String("url", "/checkout"),
    attribute.String("client_ip", "192.168.1.1"),
    attribute.Int("response_code", 200),
)

// GOOD: Semantic conventions
import "go.opentelemetry.io/otel/semconv/v1.21.0"

span.SetAttributes(
    semconv.HTTPMethod("POST"),
    semconv.HTTPRoute("/checkout"),
    semconv.NetPeerIP("192.168.1.1"),
    semconv.HTTPStatusCode(200),
)
Enterprise Governance: The Attribute Registry
For organization-specific attributes that go beyond OpenTelemetry's standard conventions, create an attribute registry that defines approved names, types, and cardinality expectations:
version: "1.0"
namespaces:

  sparkplug.order:
    attributes:
      - name: sparkplug.order.status
        type: string
        cardinality: low
        allowed_values: [pending, processing, shipped, delivered, cancelled]
        description: "Current status of order"

      - name: sparkplug.order.payment_method
        type: string
        cardinality: low
        allowed_values: [credit_card, paypal, apple_pay, google_pay]
        description: "Payment method used"

  sparkplug.user:
    attributes:
      - name: sparkplug.user.region
        type: string
        cardinality: low
        allowed_values: [us-east, us-west, eu-central, apac]
        description: "User's geographical region"

      # High-cardinality - TRACES/LOGS ONLY
      - name: sparkplug.user.id
        type: string
        cardinality: high
        allowed_in: [traces, logs]
        forbidden_in: [metrics]
        description: "Unique user identifier - DO NOT use in metrics"
From this registry, SparkPlug's platform team generated type-safe attribute helpers:
package sparkplug

// Metrics-safe attributes (low cardinality)
func OrderStatus(value string) attribute.KeyValue {
    return attribute.String("sparkplug.order.status", value)
}

func PaymentMethod(value string) attribute.KeyValue {
    return attribute.String("sparkplug.order.payment_method", value)
}

// High-cardinality - compiler error if used with metrics
func UserID(value string) trace.Attribute {  // Note: trace.Attribute, not attribute.KeyValue
    return trace.String("sparkplug.user.id", value)
}
The platform team then:
- Published a code generator that creates type-safe attribute helpers from the registry
- Configured the OTel Collector to validate and drop attributes not in the registry
- Integrated with CI/CD to flag violations during code review
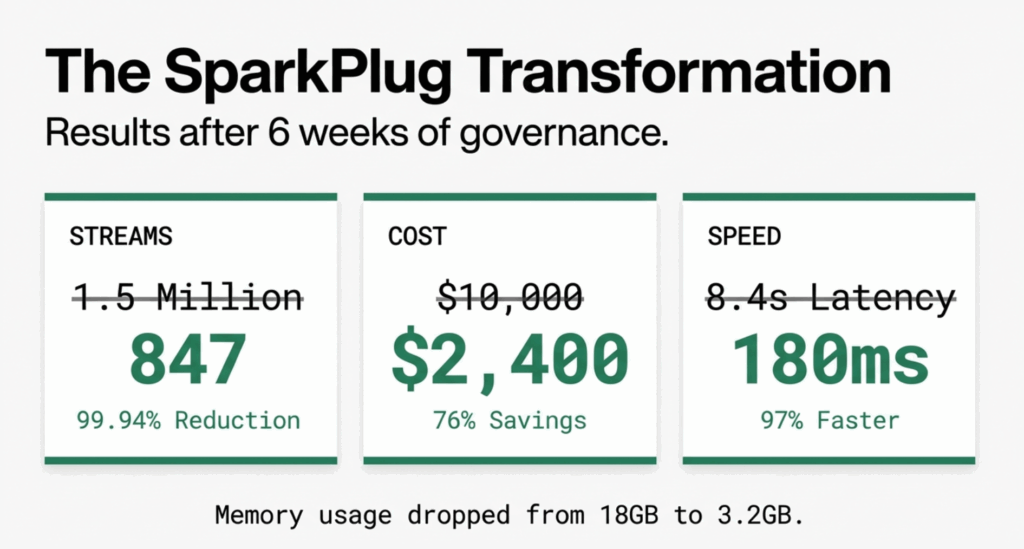
Real-World Results: SparkPlug's Transformation
After implementing all three strategies over six weeks, SparkPlug Motors saw dramatic improvements:
Cardinality Reduction
- Before: 1.5M active metric streams
- After: 847 active metric streams
- Reduction: 99.94%
Performance Improvements
- Prometheus memory usage: 18GB to 3.2GB (82% reduction)
- Grafana P95 query latency: 8.4s to 180ms (97% improvement)
- Dashboard load time: 45s to 2.1s (95% improvement)
Cost Savings
- Monthly observability costs: $10,000 to $2,400 (76% reduction)
- Prevented need for Prometheus cluster expansion (saved $15K in infrastructure)
Developer Experience
- Deployment velocity unchanged (no application code modifications required)
- Incident MTTR improved by 40% (dashboards actually usable during outages)
- Cross-team metric correlation now possible thanks to semantic conventions
Conclusion: Better Signal, Lower Bill
High cardinality is the silent budget killer in observability. It provides granular detail at a premium cost, and most high-cardinality attributes are rarely queried after the initial instrumentation.
The strategies outlined in this guide provide a practical framework:
- Centralize governance using the OTel Collector as your enforcement point
- Question uniqueness—if an attribute has millions of values, it probably belongs in traces or logs, not metrics
- Standardize naming through Semantic Conventions and an attribute registry
- Measure and iterate with regular cardinality audits
SparkPlug Motors reduced their metric streams by 99.94%, cut costs by 76%, and dramatically improved their team's ability to respond to incidents. The key wasn't collecting less data—it was collecting the right data, in the right place, at the right granularity.
Should I ever use high-cardinality attributes in metrics?+
Only if you have a specific business justification and the budget to support it. For most use cases, high-cardinality data belongs in traces or logs where you can sample and index selectively.
How do I know if cardinality is my problem?+
Look for signs like: Prometheus memory consumption growing faster than traffic, slow dashboard queries, increased observability vendor costs, or time-series databases running out of memory. Run count by (__name__) ({'{'}__name__=~".+"{'}'}) in Prometheus to identify top cardinality offenders.
Won't dropping attributes lose important debugging context?+
No, if you route high-cardinality data to the right pillar. Use metrics for trends and alerting, traces for request-level debugging, and logs for detailed context. The OTel Collector can send identical data to different destinations based on use case.
Can I apply these techniques to an existing deployment?+
Yes. The OpenTelemetry Collector sits between your applications and backends, so you can deploy it incrementally without modifying application code. Start with one service as a pilot, validate the results, then roll out to the rest.
What's the biggest mistake teams make with cardinality?+
Adding unique IDs (order IDs, user IDs, request IDs, container IDs) as metric attributes without understanding the downstream cost. Always ask: "Will I actually query by this attribute in a dashboard or alert?" If the answer is no, don't include it in metrics.