Software
PostgreSQL Plugin for
Oracle Enterprise Manager
Monitor your PostgreSQL databases with the same enterprise-grade tools you use for Oracle. Now with plan, index, and vacuum advisors that alert through the console you already run, and workload history you can replay.
200+
Metrics Monitored
5
Advisors
14–18
PostgreSQL Versions
13.5 & 24ai
Oracle EM Supported
New in the August 2026 release
Five Advisors, Findings You Can Act On
The advisors arrived in 13.5.15 for Enterprise Manager 13.5 and 24.1.1 for Enterprise Manager 24ai; the current release, 13.5.17 and 24.1.3, ships the same features on both, with fixes. Existing targets, thresholds, and alert routing carry forward unchanged.
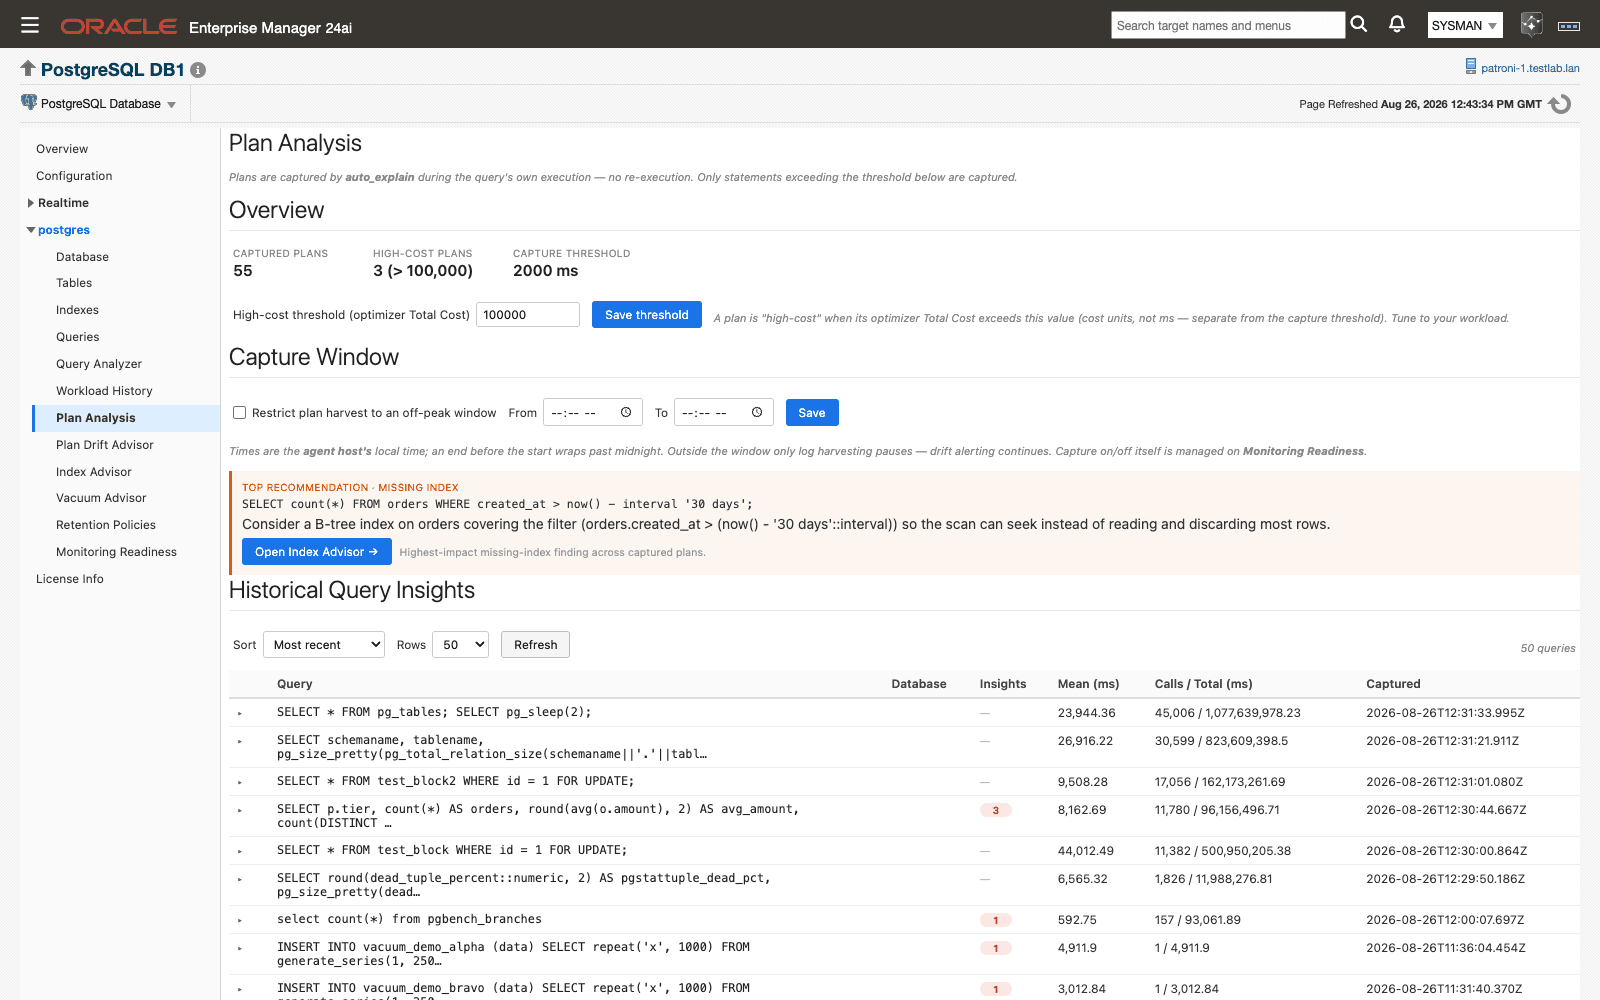
Plan Analysis
Execution plans captured passively from auto_explain, never re-executed. Five insight rules — Insufficient Index, Misestimate, Stale Statistics, Slow Sequential Scan, and Lossy Bitmap — each with the recommendation attached.
Requires: auto_explain + server-log read grant
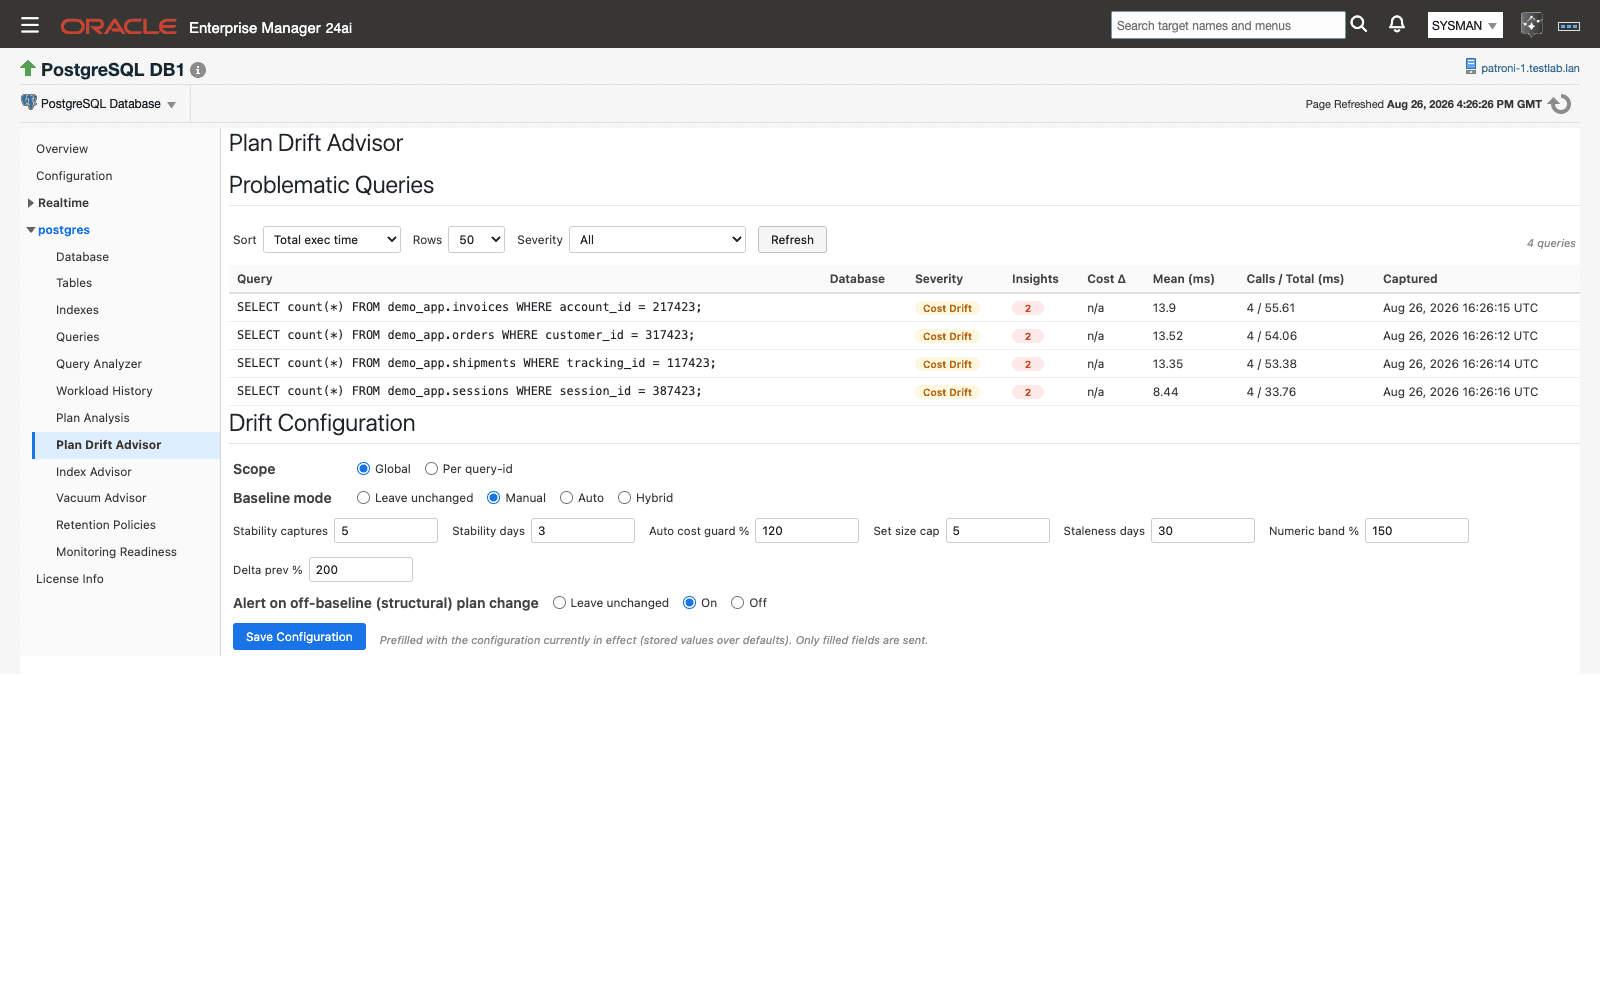
Plan Drift Advisor
Keeps accepted-good baseline plans per query and lists only the queries that have left them, with side-by-side plan comparison and an audit trail. Nothing becomes a baseline without your say-so.
Requires: auto_explain + server-log read grant
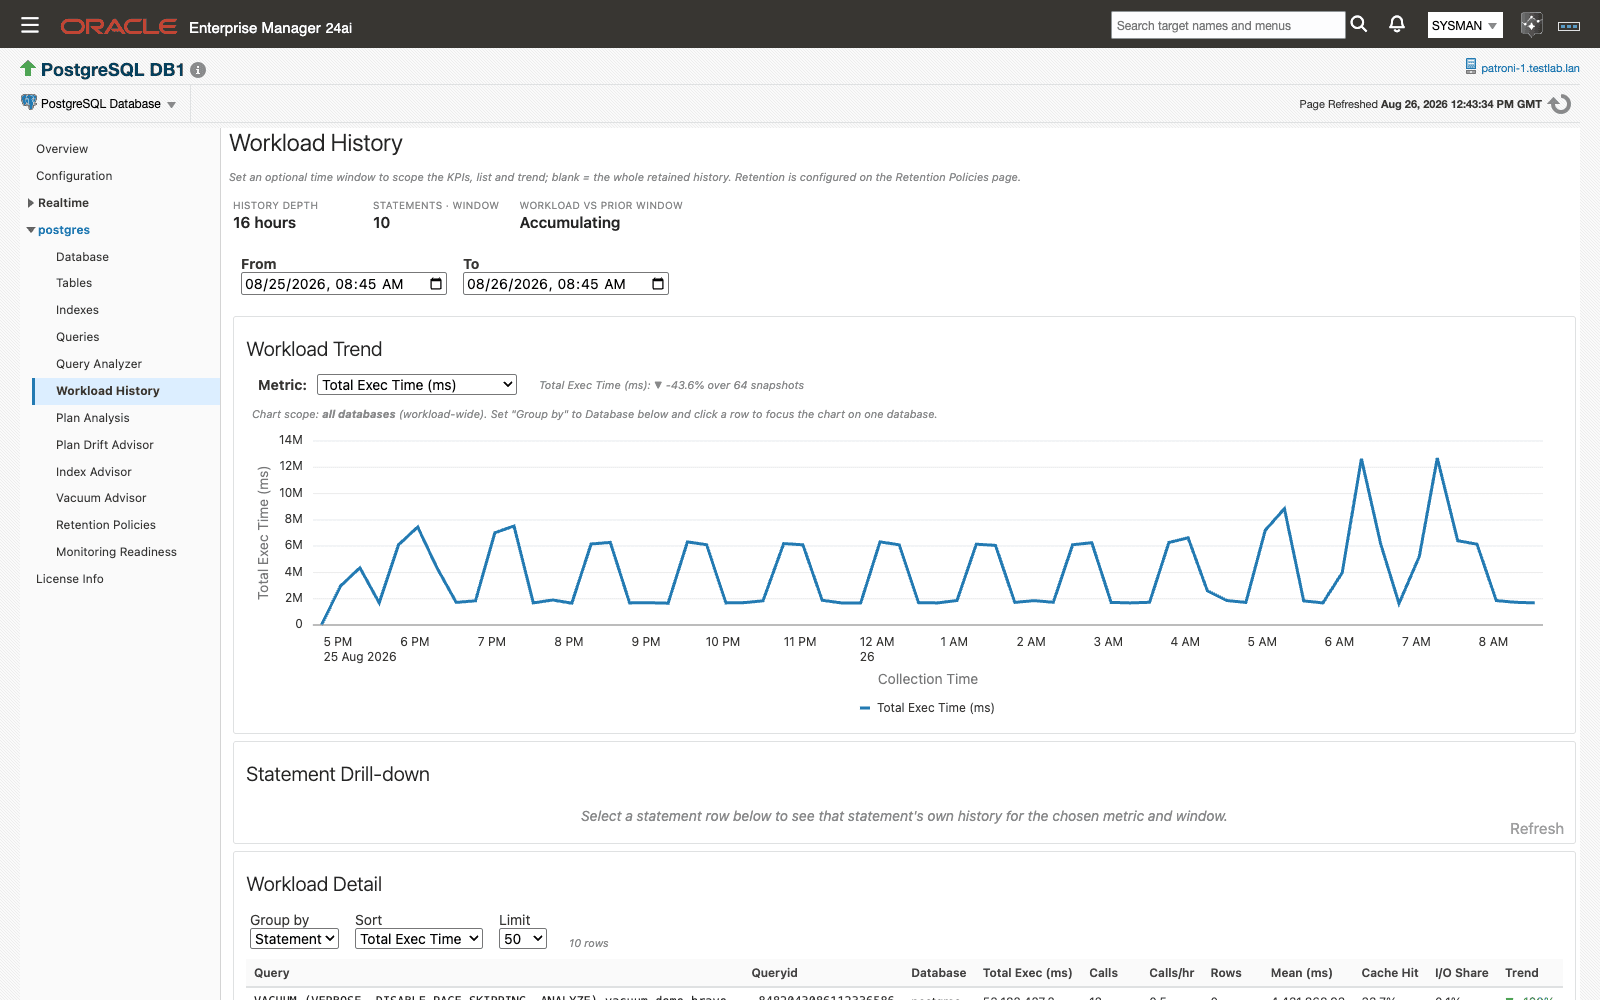
Workload History
Replays pg_stat_statements snapshots over any window. Rank statements by execution time, calls, mean, rows, or I/O share, compare against the prior window, and drill into one statement's history.
Requires: pg_stat_statements
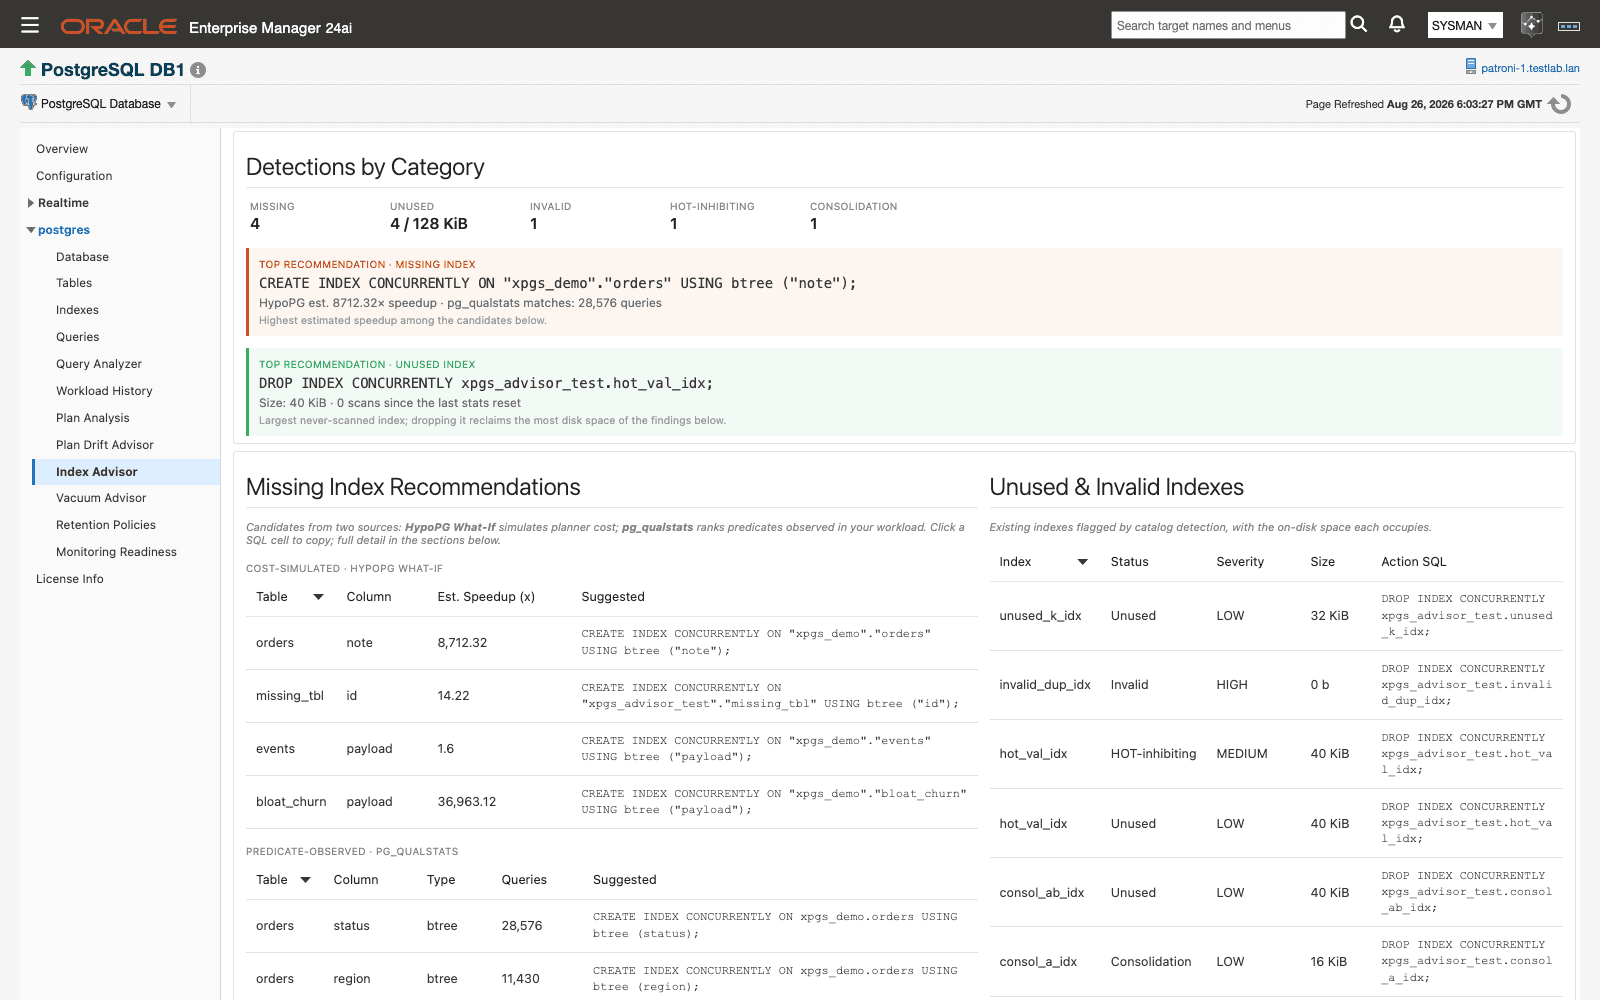
Index Advisor
Five catalog-native detections — missing, unused, invalid, HOT-inhibiting, and consolidation — with no extensions required. Add hypopg for what-if speedups and pg_qualstats for predicate-driven candidates. Every recommendation is CONCURRENTLY SQL for DBA review.
Requires: None (hypopg, pg_qualstats optional)
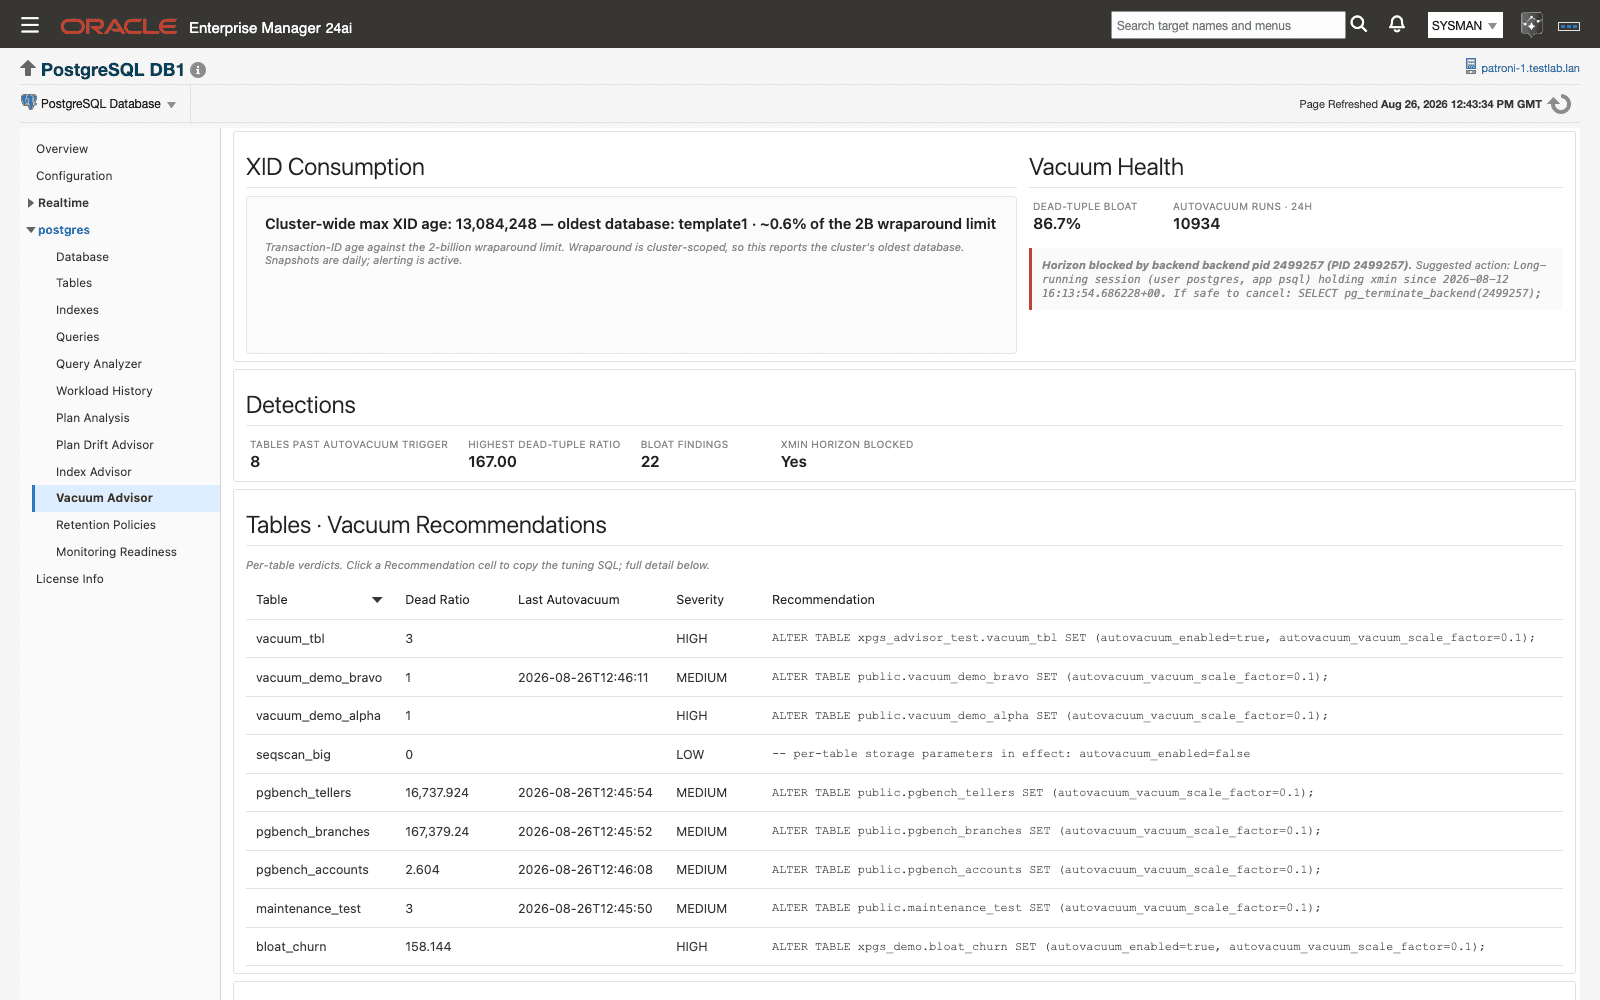
Vacuum Advisor and xmin Horizon
Recomputes each table's real autovacuum trigger point, estimates bloat, tracks transaction-ID age, and names the exact session, replication slot, or prepared transaction holding vacuum back, with the release command.
Requires: None (pgstattuple optional for bloat)
Findings become alerts, not another dashboard
Plan, index, and vacuum findings publish as standard Oracle EM metrics. Fourteen metrics ship with thresholds, three importable monitoring templates cover critical production, dev/test, and a minimal starter baseline, and incidents clear on their own when a finding resolves. The plugin never applies a recommendation for you; every action is review-and-run SQL.
See It In Action
Demo from Oracle AI World 2025
Purpose-Built Monitoring Pages
Comprehensive visibility into every aspect of your PostgreSQL environment, right inside Oracle Enterprise Manager.
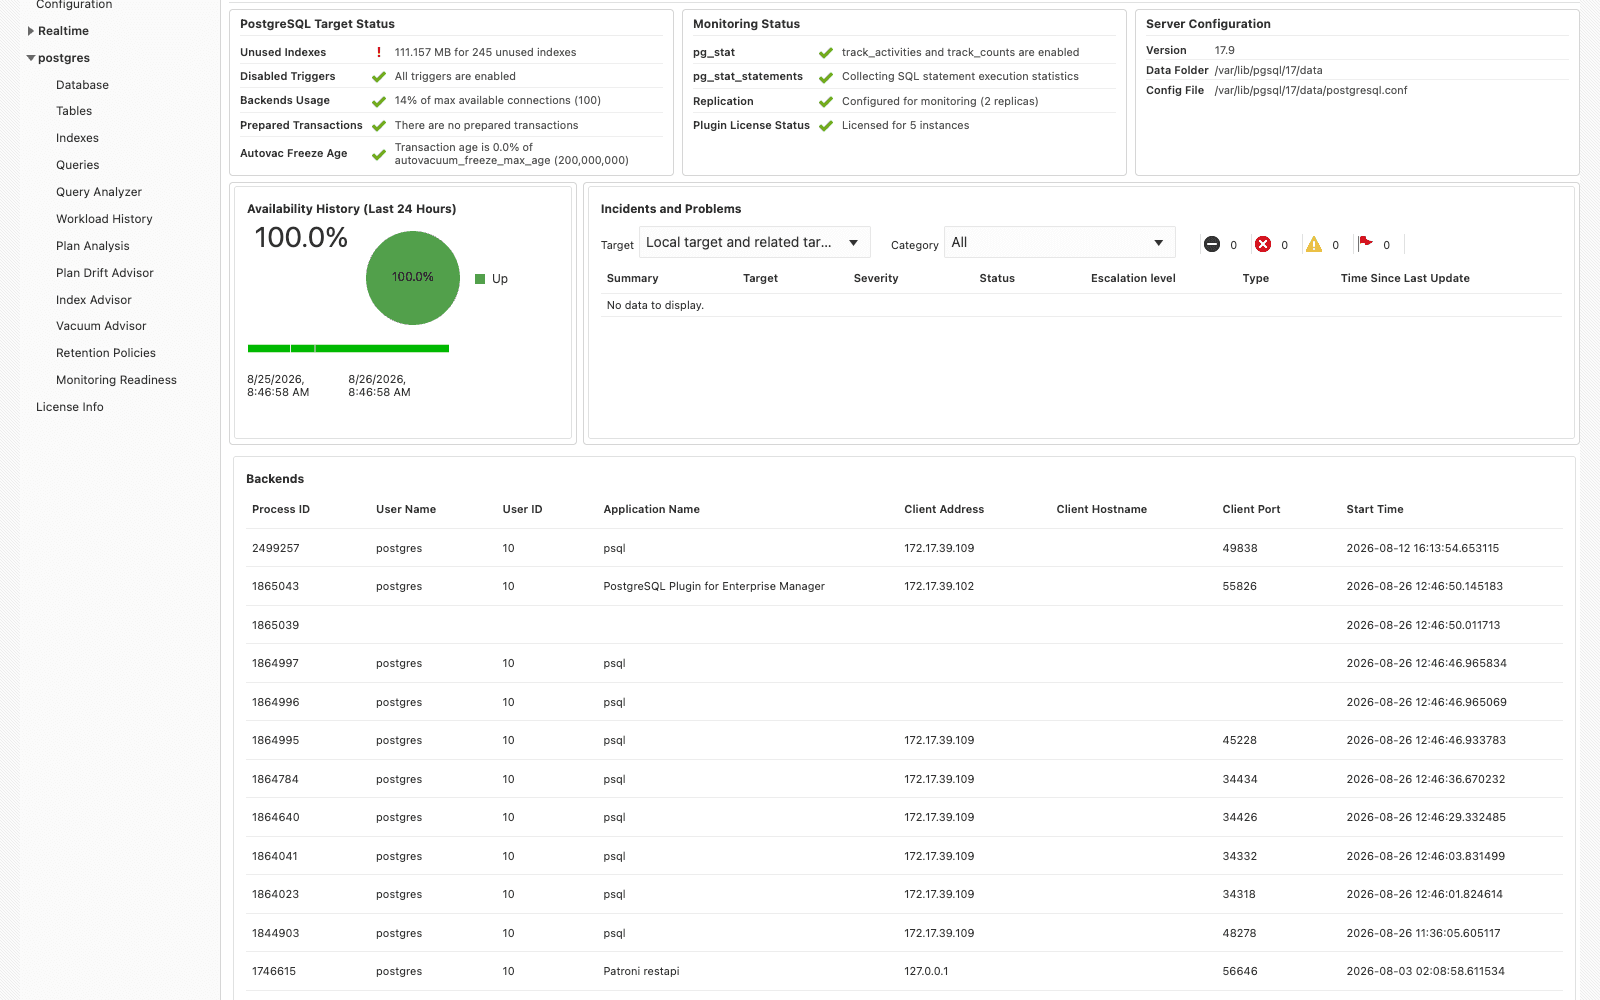
Overview
Target status, incidents, backends, replication, background writer, and connections over time.
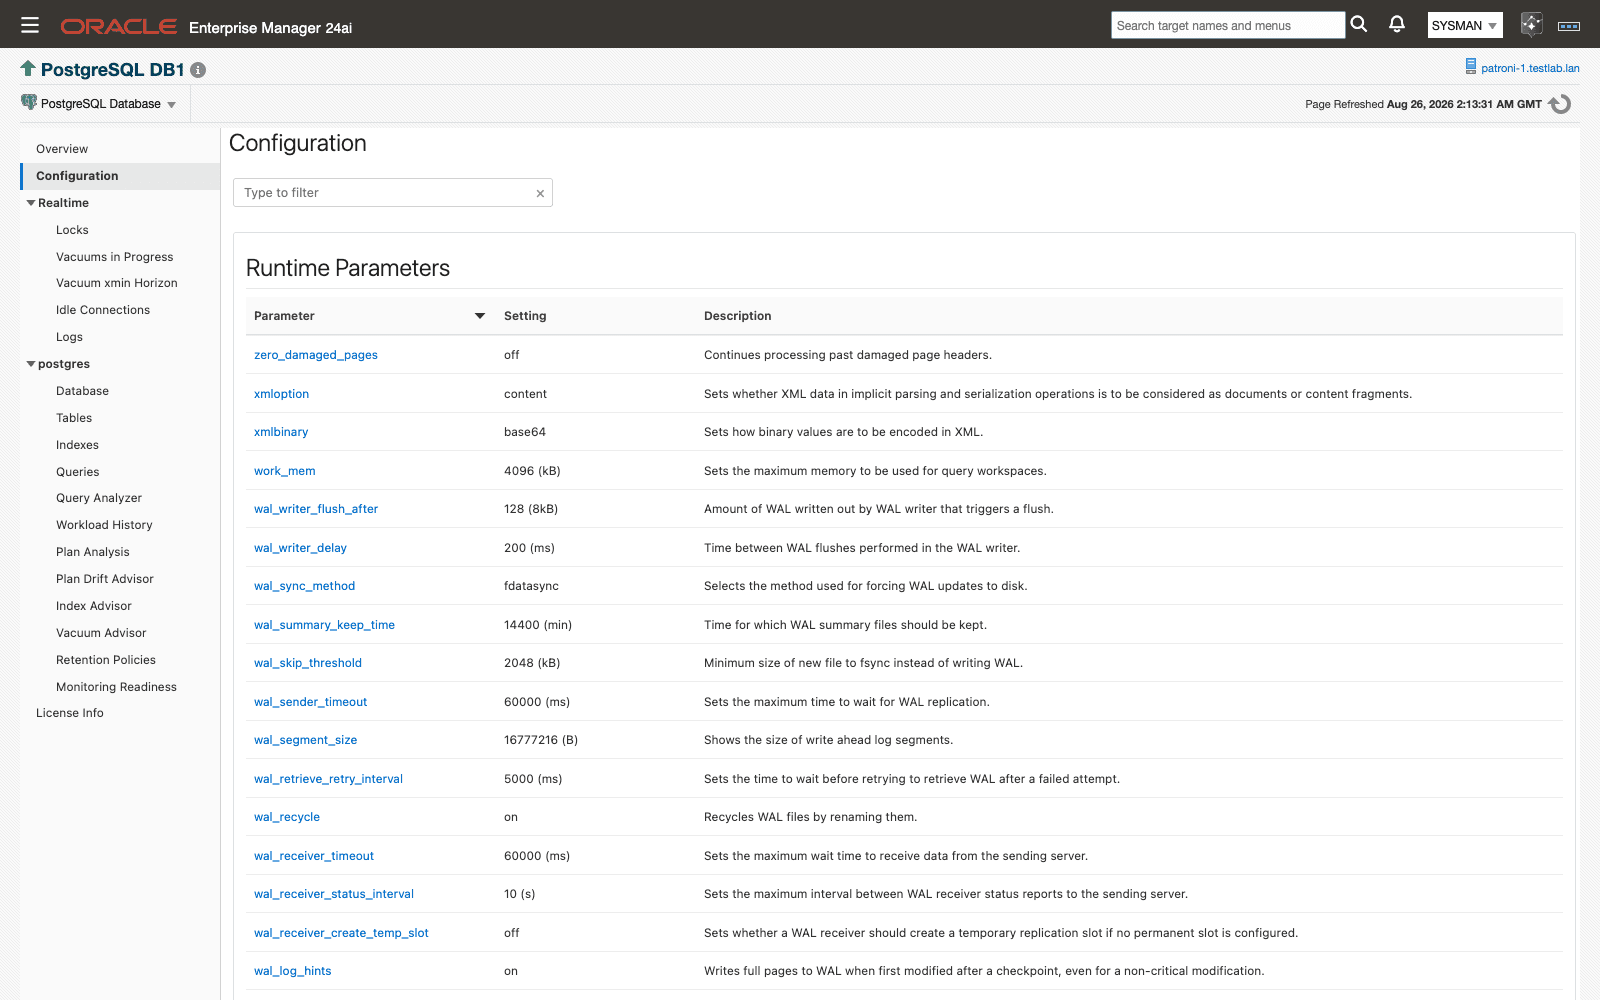
Configuration
Every runtime parameter with its current, boot, and reset values.
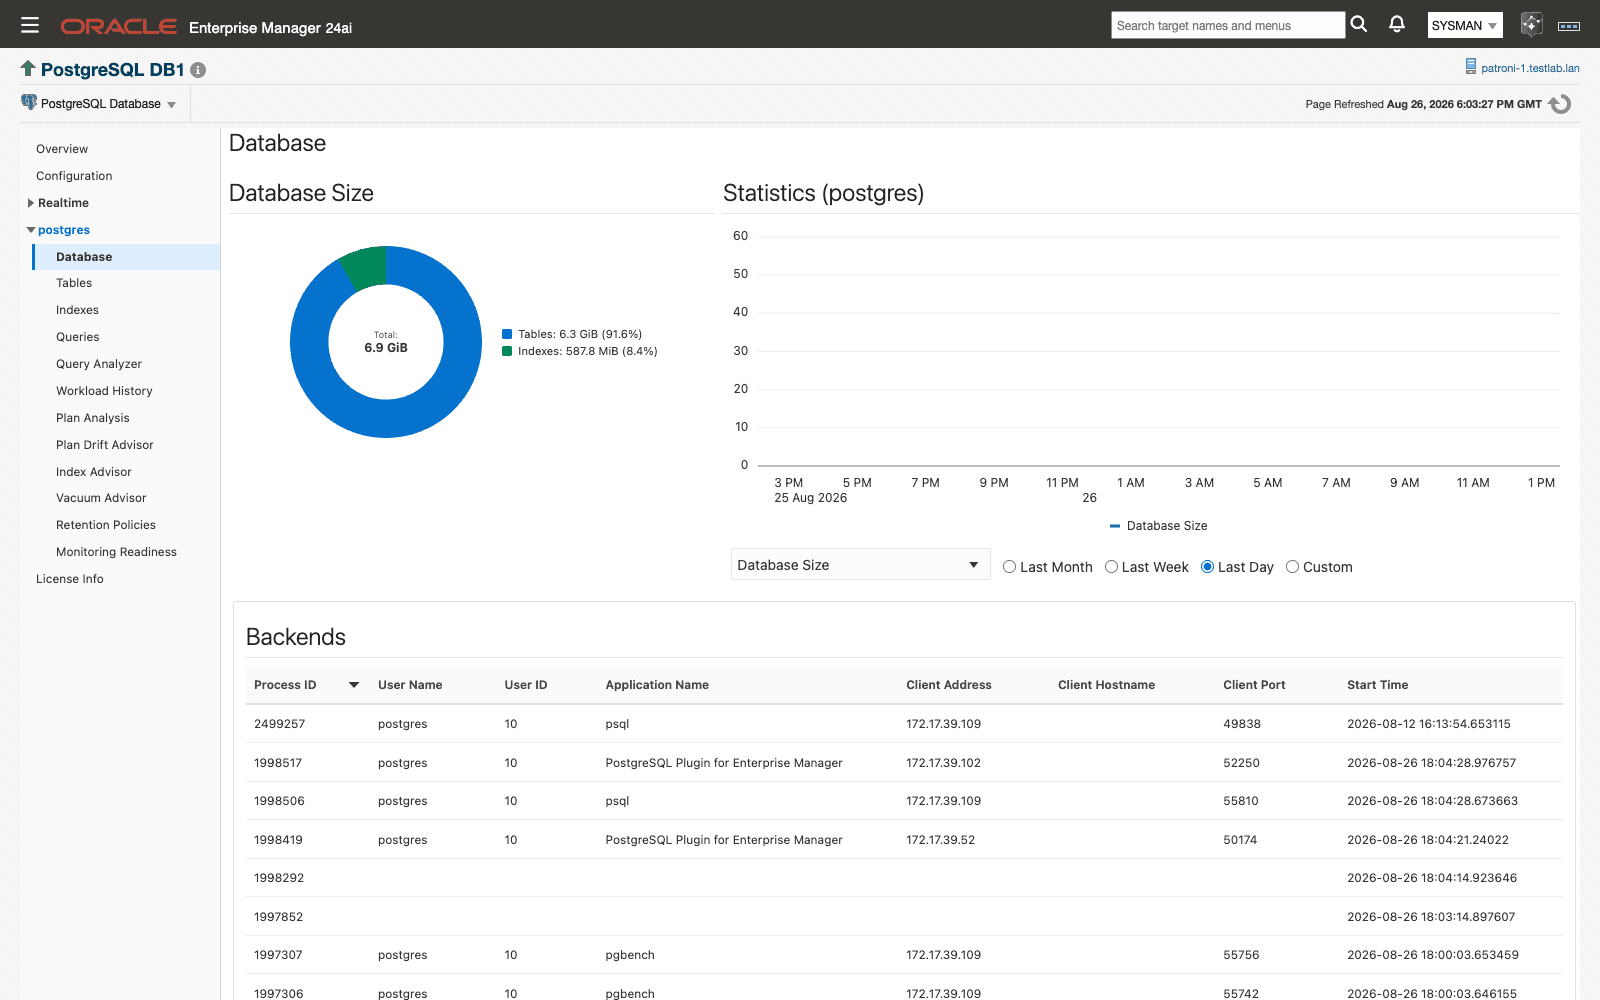
Database
Per-database size, statistics charts, and live backends.
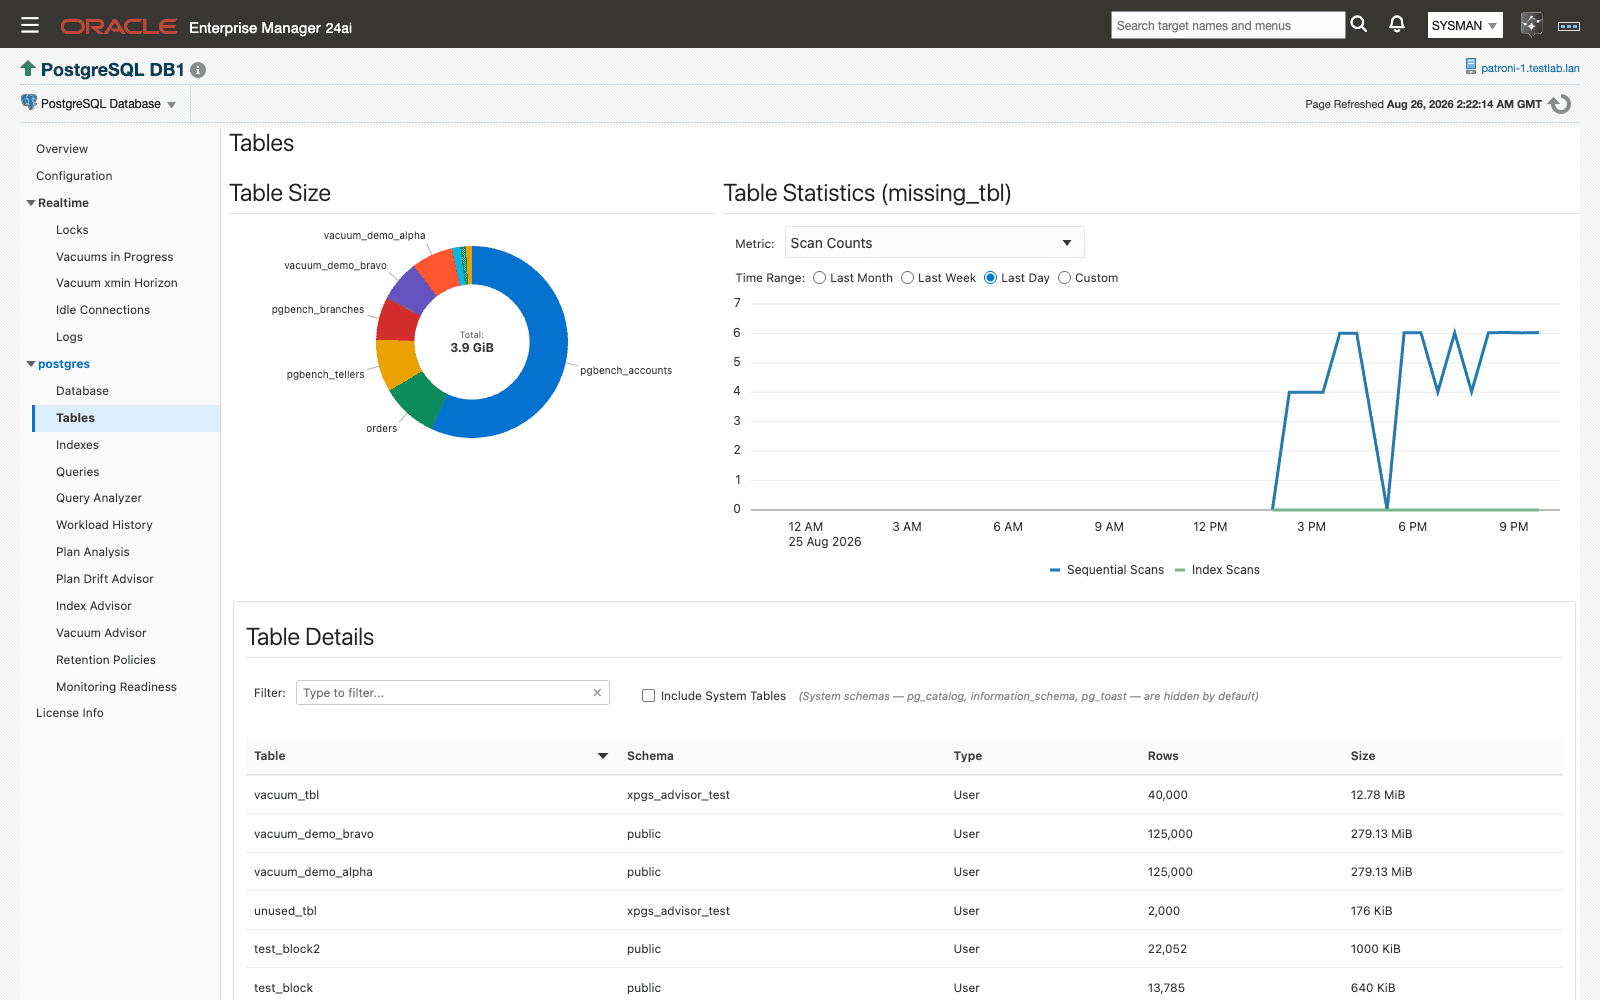
Tables
Size and statistics for every table in the selected database.
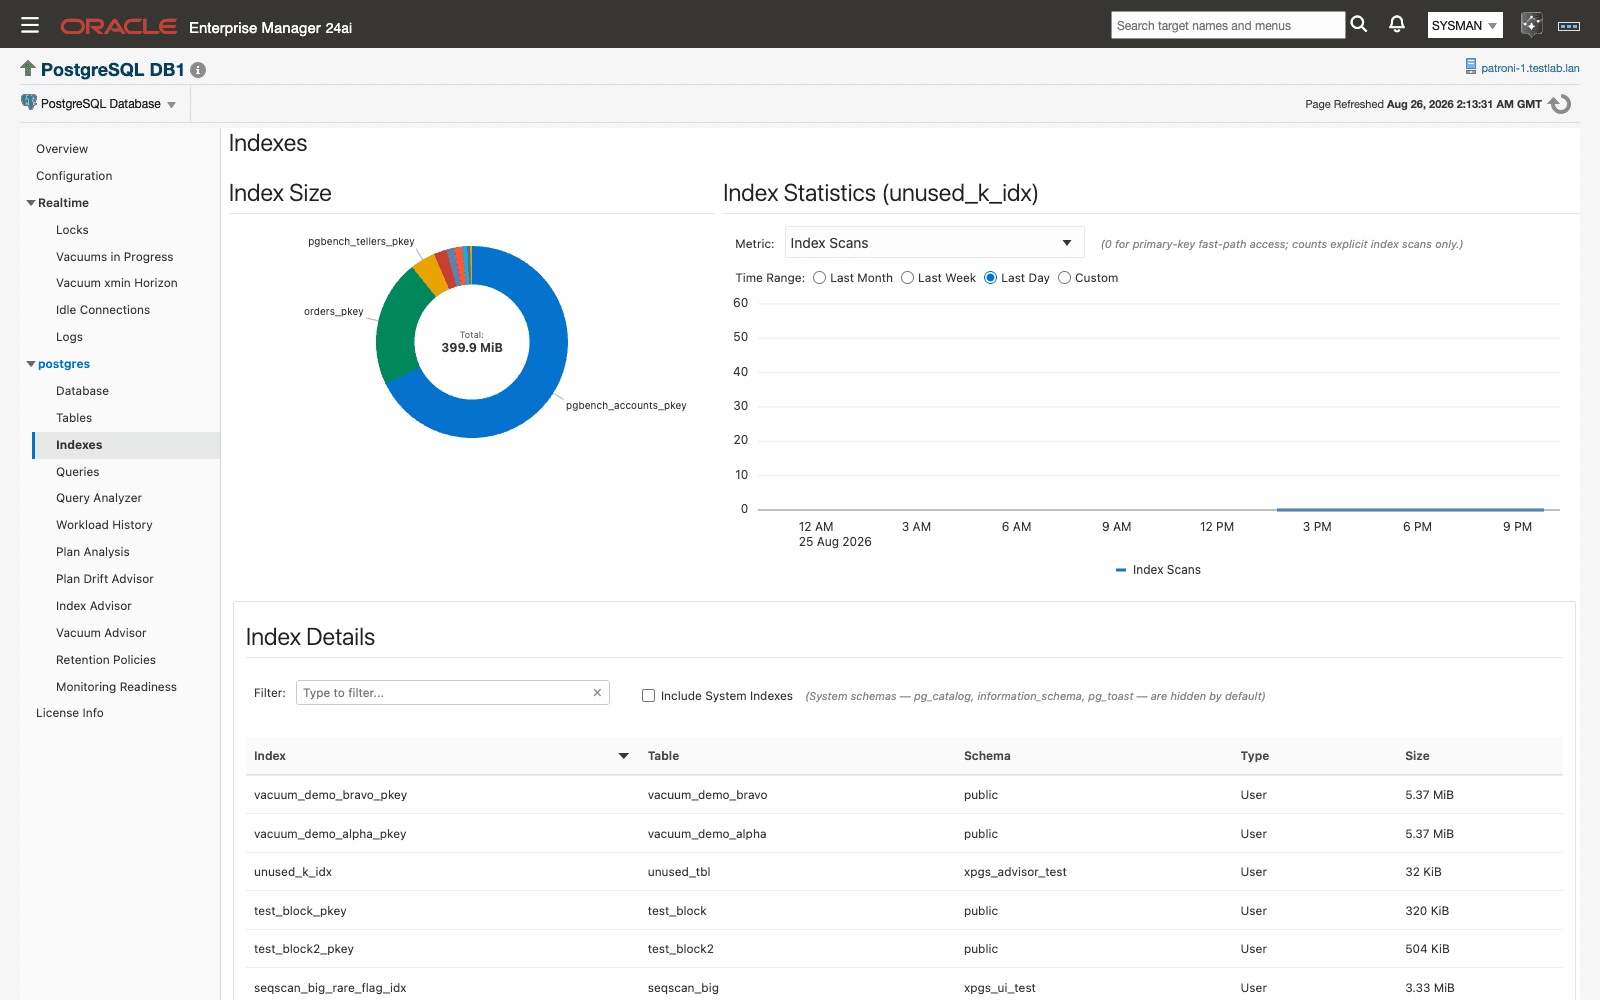
Indexes
Size, usage, and statistics for every index in the selected database.
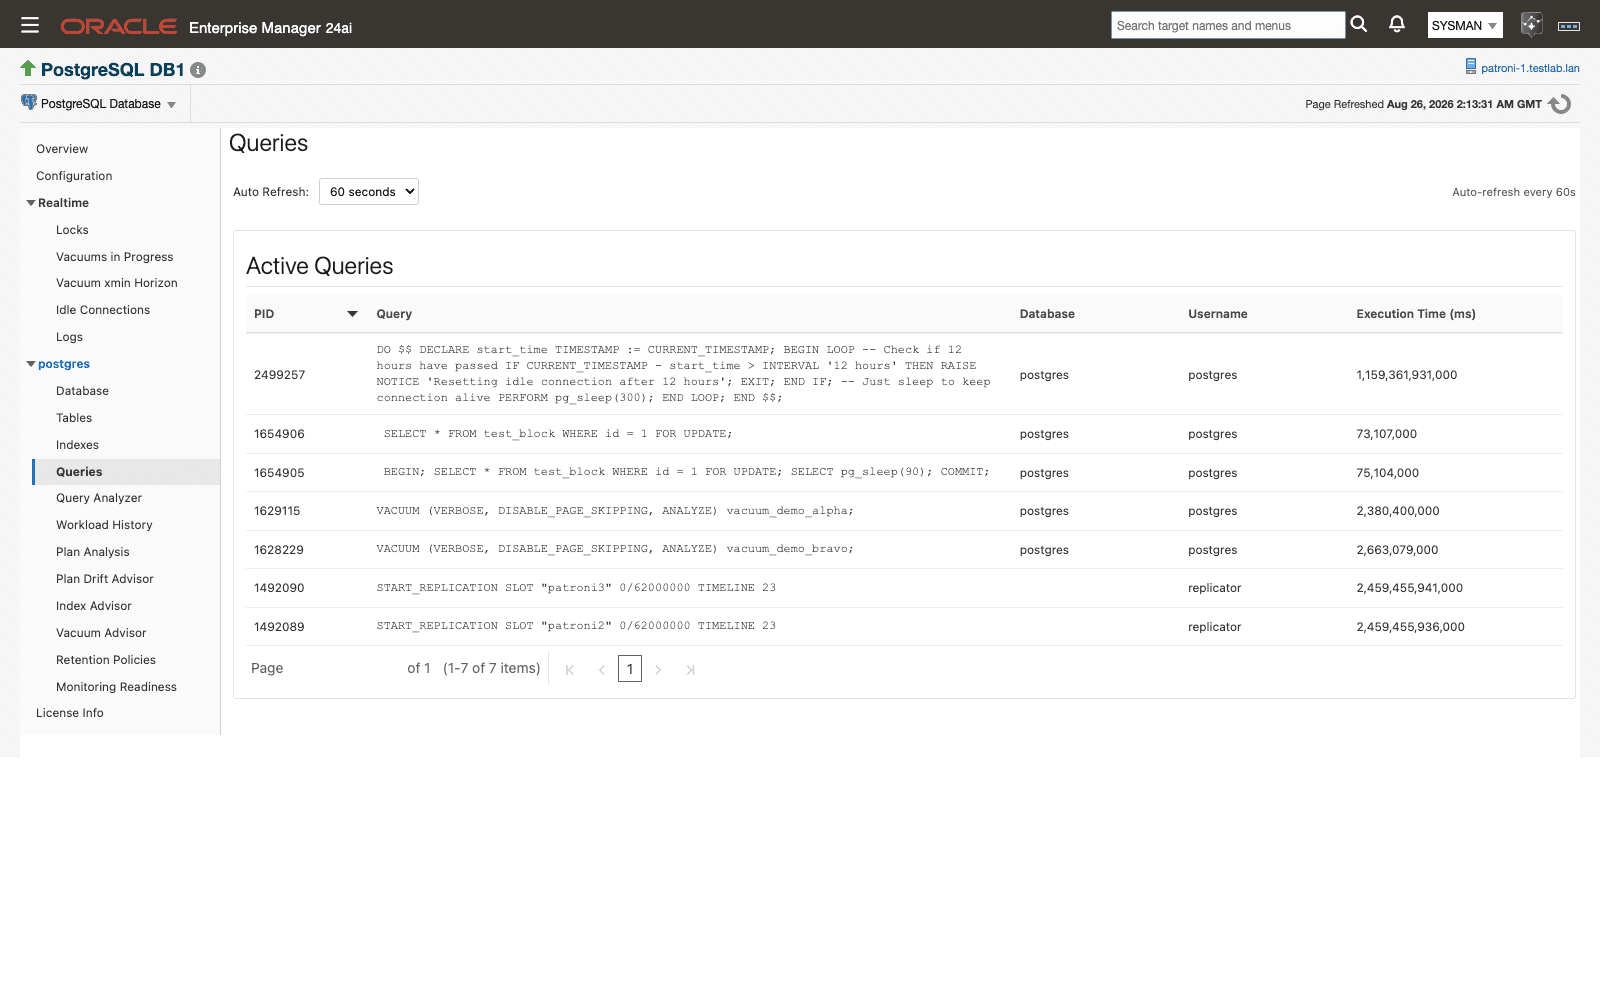
Queries
Live view of currently executing statements from pg_stat_activity.
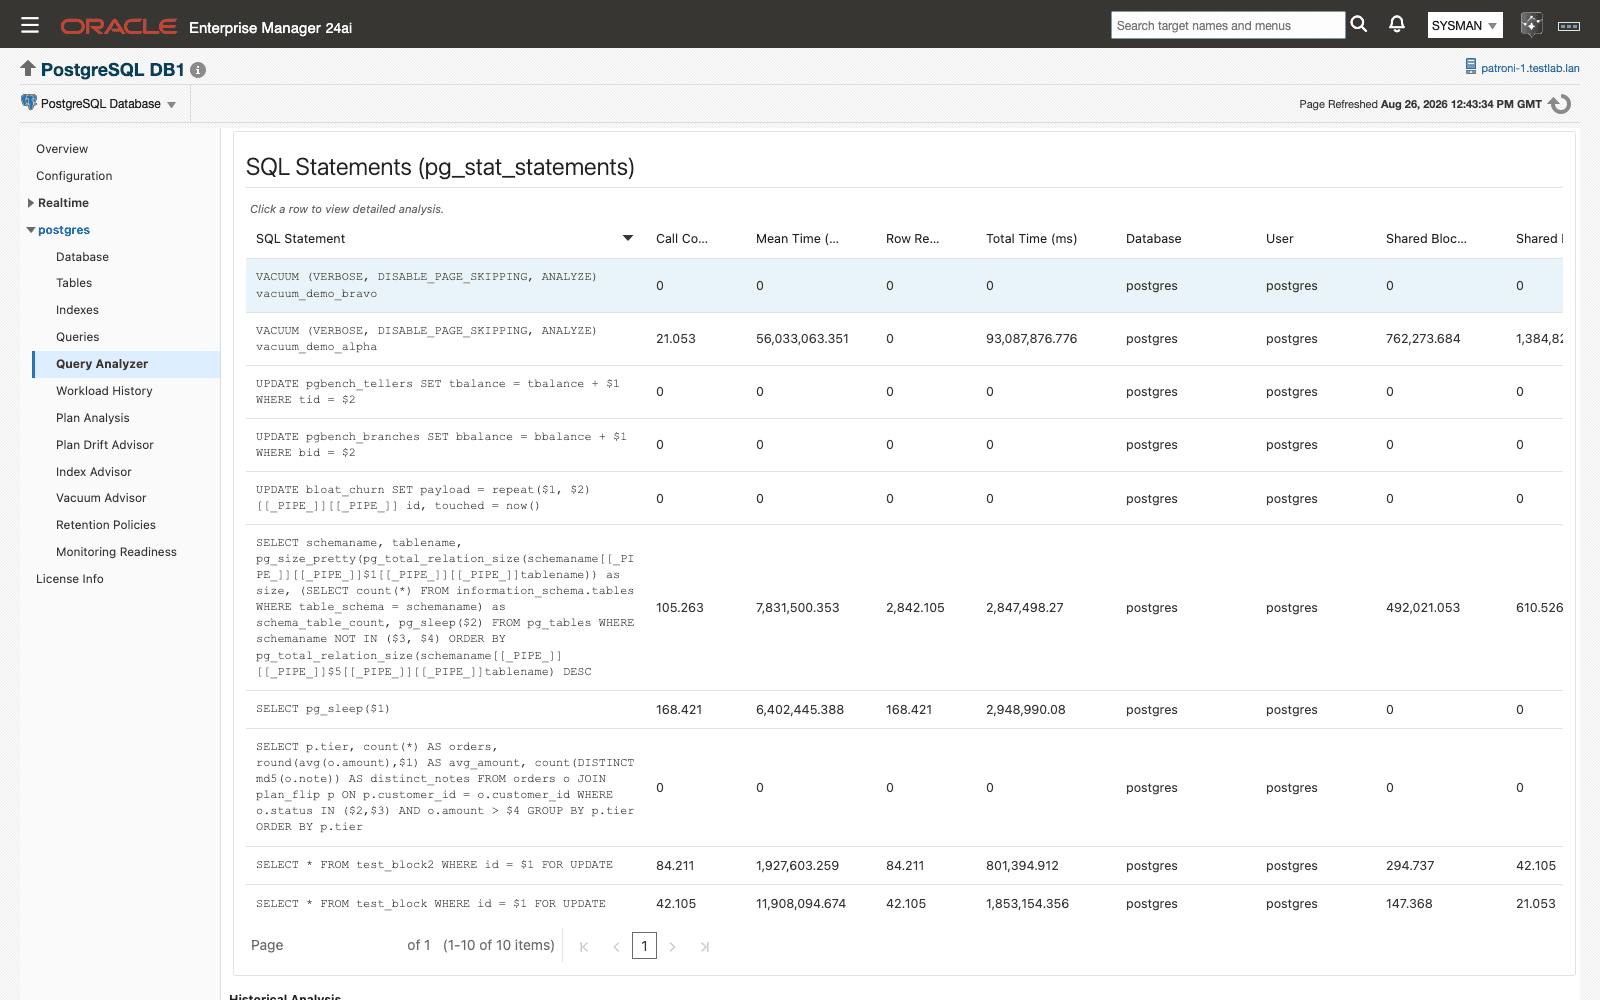
Query Analyzer
Per-statement detail from pg_stat_statements with historical charts and sampled wait events.
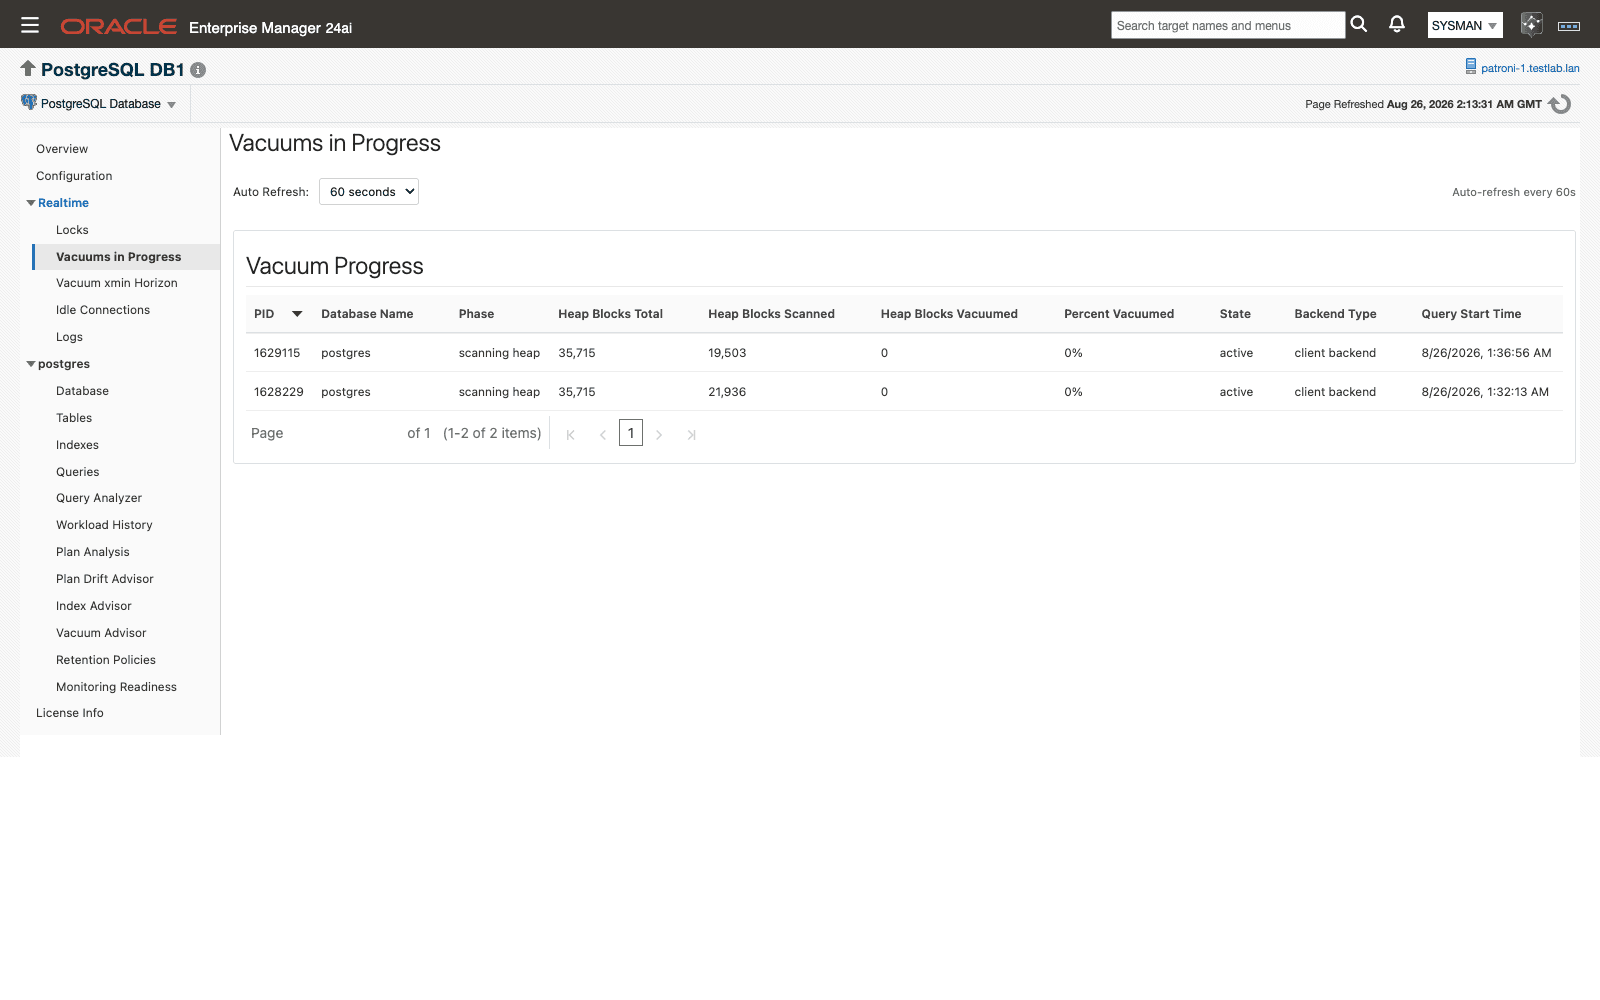
Realtime
Vacuums in progress phase by phase, locks and blocking sessions, the xmin horizon, idle connections, and parsed server logs (local agents).
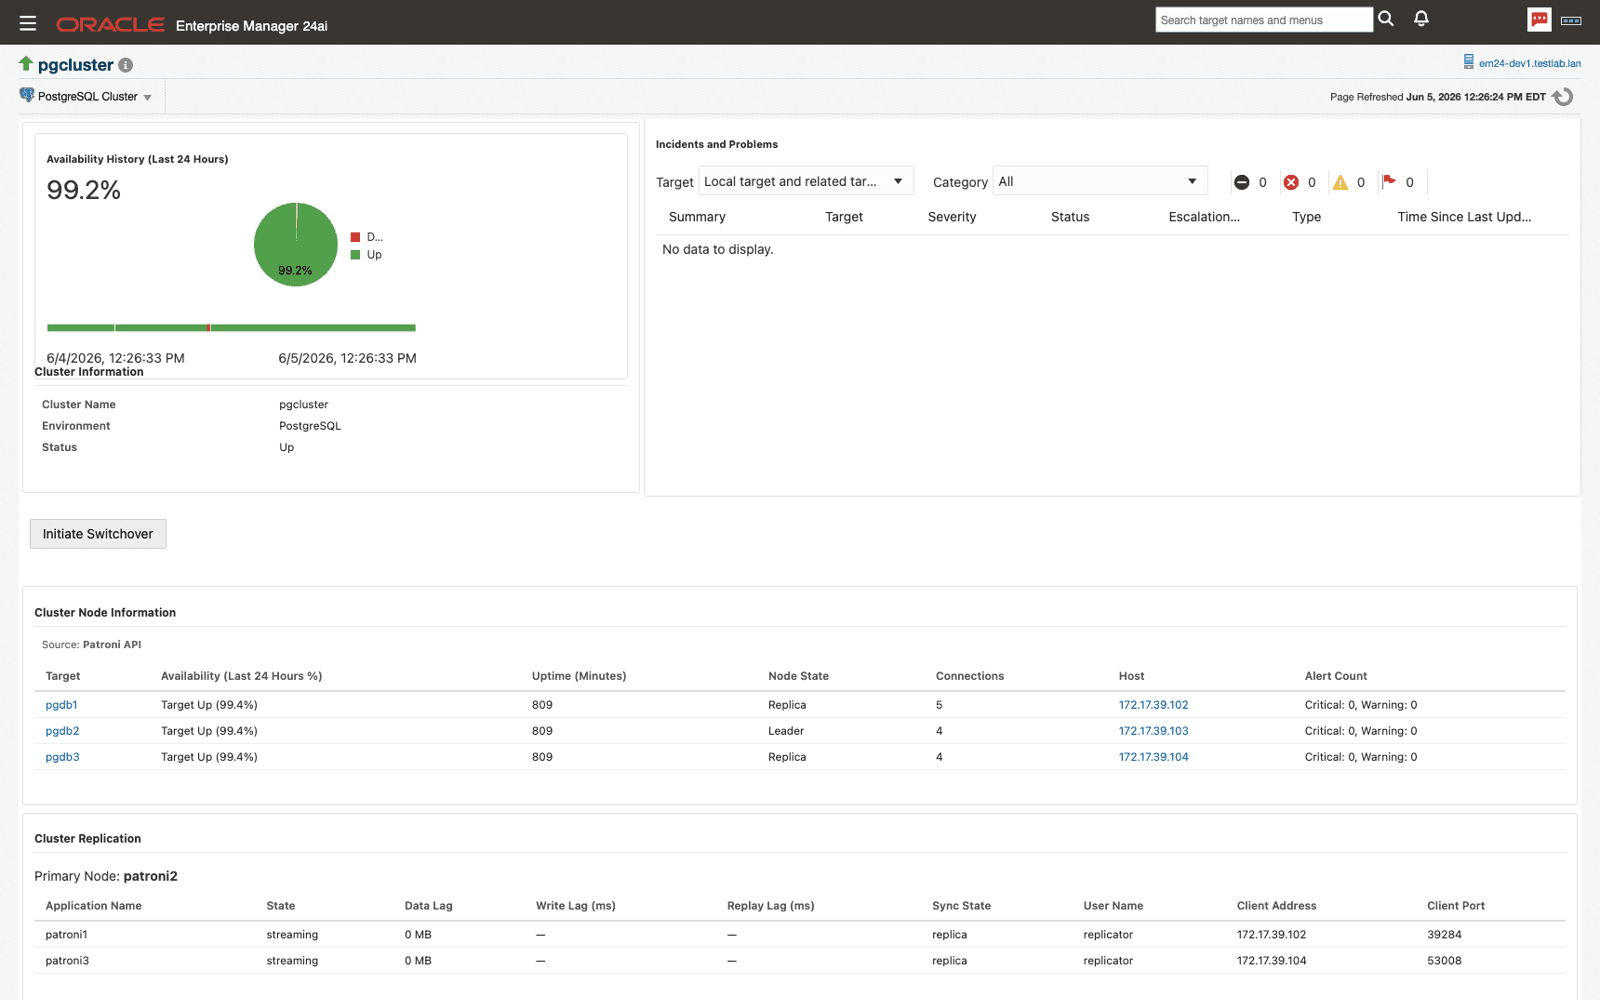
Cluster Home
Cluster and node information, replication status, and switchover control for Patroni-managed clusters.
Enterprise-Grade Capabilities
Go beyond basic monitoring with cluster awareness, alerting that fits your workflow, and history that stays on the agent.
Patroni Cluster Monitoring and Switchover
Cluster topology, member roles, and replication state read from the Patroni REST API, so your view survives a failed primary. Initiate switchovers from Oracle EM without leaving the console.
Alerting with Shipped Templates
Fourteen metrics ship with thresholds and three importable monitoring templates. Advisor findings open standard EM incidents, route through your existing connectors, and clear when the finding resolves.
Query Analyzer
Per-statement detail from pg_stat_statements, historical charts, and sampled wait events from pg_wait_sampling for every statement on the target.
Realtime Pages
Blocking sessions and lock waits, vacuums in progress phase by phase, the session holding back the xmin horizon, idle connections, and parsed server logs (local agents), refreshed live.
Agent-Local History Store
Ninety days of workload, plan, and advisor history per target by default, kept in a SQLite store on the agent host without growing the OMS repository. Retention days and size ceilings are editable per target.
Collection Throttle
Set CPU and memory thresholds on local Linux agents and heavy collections pause while the host is busy. Availability checks and realtime pages are never gated.
Operational Jobs
Backup and restore with pg_dump and pg_restore, kill idle or idle-in-transaction sessions (local agent), and run Patroni switchovers, all as Oracle EM jobs with job history.
Custom Metric Extensions
Define custom SQL queries as Oracle EM Metric Extensions to monitor application-specific metrics beyond the built-in set.
Unified Monitoring
Manage PostgreSQL alongside Oracle in a single pane of glass. Eliminate tool sprawl and context switching.
Broad Compatibility
Enterprise-ready support across the platforms and versions you rely on.
PostgreSQL
14, 15, 16, 17, 18
Oracle Enterprise Manager
Cloud Control 13.5 (13.5.0.0.0+), 24ai (24.1.0.0.0+)
Operating Systems
Linux 64-bit, Windows 64-bit (agents); All OMS-supported platforms
PostgreSQL Extensions
pg_stat_statements (required); auto_explain for plan capture. Optional: hypopg, pg_qualstats, pg_wait_sampling, pgstattuple
How It Works
Deploy the Plugin
Import the OPAR with emcli and deploy it to the OMS and agents. Upgrading from any 13.5.x release? Your targets, thresholds, and credentials carry forward unchanged.
Add Targets
Add PostgreSQL Database and Cluster targets with connection details and credentials, from the console or scripted with emcli add_target.
Check Monitoring Readiness
One page shows which features are ready on each target and configures auto_explain for you. Extensions and the server-log grant stay under your control.
Monitor and Act
Dashboards and alerts from the first collection; advisors fill in as history and baselines accumulate. Every recommendation is review-and-run SQL; the plugin never applies a recommendation for you.
See How It Scales
Learn how a Fortune 100 bank chose the Integration Plumbers plugin to monitor 2,000+ PostgreSQL instances across 40 countries.
Get a Custom Quote
Ready to add PostgreSQL monitoring to your Oracle Enterprise Manager? Build a quote in minutes and receive detailed pricing by email.
Ready to Unify Your Database Monitoring?
See how the PostgreSQL Plugin for Oracle Enterprise Manager can simplify your operations.