Introduction: Two Thousand Databases and No Single Source of Truth
Picture this: a Fortune 100 bank operating in 40 countries, processing millions of transactions per day. Over the past five years, they've been steadily migrating workloads from proprietary commercial databases to PostgreSQL — drawn by the open-source licensing model, the thriving community, and the freedom from vendor lock-in.
The migration strategy worked. PostgreSQL now powers their core banking APIs, fraud detection pipelines, customer analytics platforms, and regulatory reporting systems. Across their global data centers and private cloud environments, the bank runs more than 2,000 PostgreSQL instances, many organized into Patroni high-availability clusters that must stay online around the clock.
But the monitoring strategy didn't keep pace with the migration.
Each regional team had adopted its own approach. The North American operations used a Prometheus and Grafana stack maintained by a dedicated SRE team. The European group relied on a commercial APM vendor. The Asia-Pacific teams used a mix of pgAdmin, custom scripts, and manual health checks. Meanwhile, the bank's Oracle databases — still running critical legacy workloads — were monitored through Oracle Enterprise Manager, a platform the operations team had used for over a decade.
The result was exactly what you'd expect: fragmented visibility, inconsistent alerting, and incident response calls where the first thirty minutes were spent figuring out which dashboard to look at.
When the bank's CISO mandated a unified monitoring strategy for all database platforms — driven in part by regulatory pressure from multiple financial authorities — the infrastructure team evaluated every PostgreSQL monitoring solution on the market. They needed something that could handle their scale, integrate with their existing Oracle Enterprise Manager investment, and satisfy the compliance requirements of operating in heavily regulated jurisdictions around the world.
They chose the Integration Plumbers' PostgreSQL Plugin for Oracle Enterprise Manager. Here's why.
Key Terms
Oracle Enterprise Manager (OEM): Oracle's enterprise-class platform for monitoring, managing, and automating Oracle and non-Oracle infrastructure. It provides a centralized console for thousands of targets across an organization's entire technology stack.
Patroni: An open-source high-availability solution for PostgreSQL that manages automatic failover, switchover, and cluster orchestration. Widely used in enterprise PostgreSQL deployments.
Tool Sprawl: The proliferation of disconnected monitoring tools across an organization, each covering a different subset of infrastructure. Tool sprawl increases operational overhead, slows incident response, and creates gaps in visibility.
MTTR (Mean Time to Resolution): The average time it takes to fully resolve an incident from the moment it's detected. Lower MTTR directly correlates with reduced downtime costs.
Single Pane of Glass: A unified monitoring interface that provides visibility across multiple platforms, database types, and infrastructure layers from one console — eliminating the need to switch between tools during incident response.
The Challenge: PostgreSQL at Banking Scale
PostgreSQL adoption in the financial services industry has accelerated dramatically. The appeal is straightforward: it's open source, it's powerful, and it eliminates the multi-million-dollar licensing costs that come with proprietary database platforms. For a global bank running thousands of instances, those licensing savings alone can reach eight figures annually.
But adopting PostgreSQL at scale introduces monitoring challenges that most organizations don't encounter when they're running fifty or even a hundred instances.
Thousands of Instances, Dozens of Teams
At this bank, PostgreSQL instances are owned by more than thirty application teams spread across four continents. Each team has different performance requirements, different SLAs, and different levels of PostgreSQL expertise. A monitoring solution that works for a single team managing twenty instances doesn't necessarily work when you need consistent visibility across the entire fleet.
High-Availability Clusters Everywhere
Nearly every production PostgreSQL deployment at the bank runs in a Patroni cluster with at least one synchronous replica. Managing failover and switchover across hundreds of Patroni clusters — and knowing the state of every cluster at any moment — is a challenge that most monitoring tools weren't designed to address.
Regulatory Compliance Is Non-Negotiable
Financial regulators in the United States, European Union, and Asia-Pacific all require evidence of comprehensive database monitoring. Auditors don't just want to see that you have monitoring — they want to see that you have consistent, documented monitoring with alerting policies, historical performance data, and capacity planning evidence. A patchwork of disconnected tools makes audit preparation a manual, error-prone ordeal.
Oracle and PostgreSQL Must Coexist
The bank isn't abandoning Oracle. Hundreds of Oracle Database instances still run mission-critical workloads, and Oracle Enterprise Manager is the established platform for managing them. Any PostgreSQL monitoring solution that forces the operations team to maintain a separate platform for PostgreSQL creates exactly the kind of tool sprawl the CISO was trying to eliminate.
Why Existing Solutions Fell Short
The bank's infrastructure team spent three months evaluating PostgreSQL monitoring options. They assessed standalone PostgreSQL monitoring tools, commercial APM platforms, and open-source stacks. None could satisfy all four of their core requirements: scale, unification with Oracle, operational simplicity, and compliance readiness.
Standalone PostgreSQL Tools
Dedicated PostgreSQL monitoring tools like pgwatch2 and PMM (Percona Monitoring and Management) provide excellent visibility for PostgreSQL-specific metrics. But they operate as isolated platforms. The bank would still need Oracle Enterprise Manager for their Oracle databases, meaning two consoles, two alerting pipelines, two sets of dashboards, and two operational workflows. At 2,000+ instances, the overhead of maintaining a parallel monitoring infrastructure was unacceptable.
Commercial APM Platforms
Enterprise APM vendors like Datadog, New Relic, and Dynatrace offer PostgreSQL integrations. But these integrations are designed as components of a broader application monitoring platform, not as deep database monitoring tools. The bank found that the PostgreSQL metrics available through these platforms were shallow compared to what their DBAs needed — and the per-host pricing model at 2,000+ instances made the total cost prohibitive.
Prometheus and Grafana
The Prometheus/Grafana stack was already in use at the bank's North American operations, and it worked well at that regional scale. But scaling it globally introduced challenges: federation across data centers, long-term metric storage, centralized alerting, and the engineering headcount required to maintain custom dashboards and exporters for every PostgreSQL version and cluster topology. The infrastructure team estimated they would need four to six full-time engineers just to operate the monitoring stack — engineers they didn't have.
The Missing Piece: OEM Integration
Every solution the bank evaluated had the same fundamental limitation: none of them integrated with Oracle Enterprise Manager. The operations team would still be switching between two platforms during incident response, maintaining two alerting configurations, and explaining to auditors why their monitoring strategy was split across disconnected tools.
The Integration Plumbers Difference: Scale Through Oracle Enterprise Manager
The Integration Plumbers' PostgreSQL Plugin for Oracle Enterprise Manager solved every challenge the bank faced — because it was built specifically for enterprises that run PostgreSQL alongside Oracle at scale.
The key insight is architectural: Oracle Enterprise Manager was designed from the ground up to manage thousands of targets across global infrastructure. It already handles the hard problems of scale — centralized target discovery, hierarchical alerting, role-based access control, historical metric retention, and compliance reporting. Rather than building a new monitoring platform that tries to replicate these capabilities, the Integration Plumbers plugin brings PostgreSQL directly into OEM as a first-class citizen.
No other PostgreSQL monitoring solution can leverage that foundation. And at banking scale, that foundation is the difference between a solution that works and a solution that works at 2,000 instances.
200+ Metrics, Purpose-Built for PostgreSQL
The plugin collects over 200 metrics from each PostgreSQL instance, covering everything from connection pool utilization and transaction throughput to vacuum activity, replication lag, and WAL generation rates. These aren't generic database metrics — they're the specific data points that PostgreSQL DBAs need to diagnose performance issues and plan capacity.
Seven Purpose-Built Dashboards
Out of the box, the plugin provides seven dashboards designed for different operational needs:
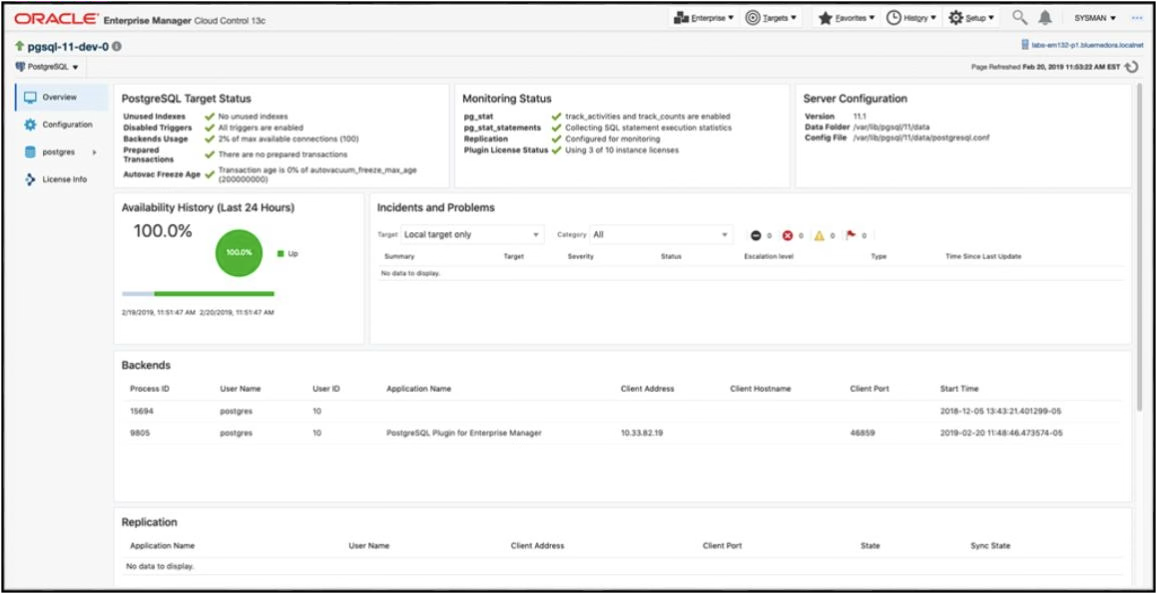
The Overview dashboard provides immediate health visibility: replication status, active backends, background writer performance, and overall instance health — all at a glance.
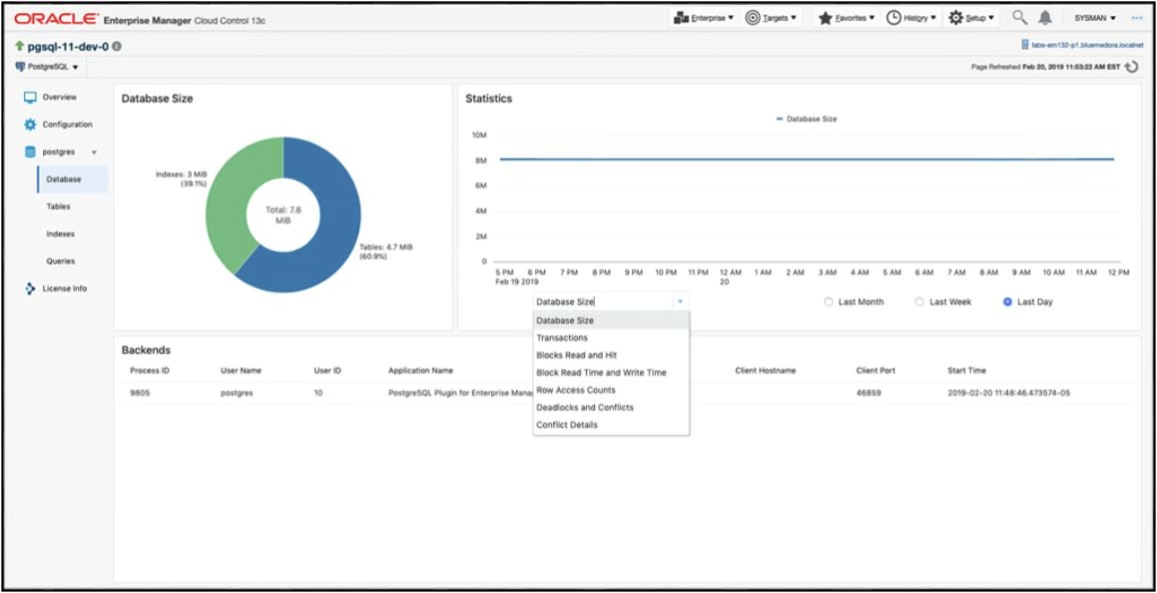
The Database dashboard drills into per-database metrics: backend connections, storage growth trends, and deadlock tracking that helps DBAs identify contention before it impacts applications.
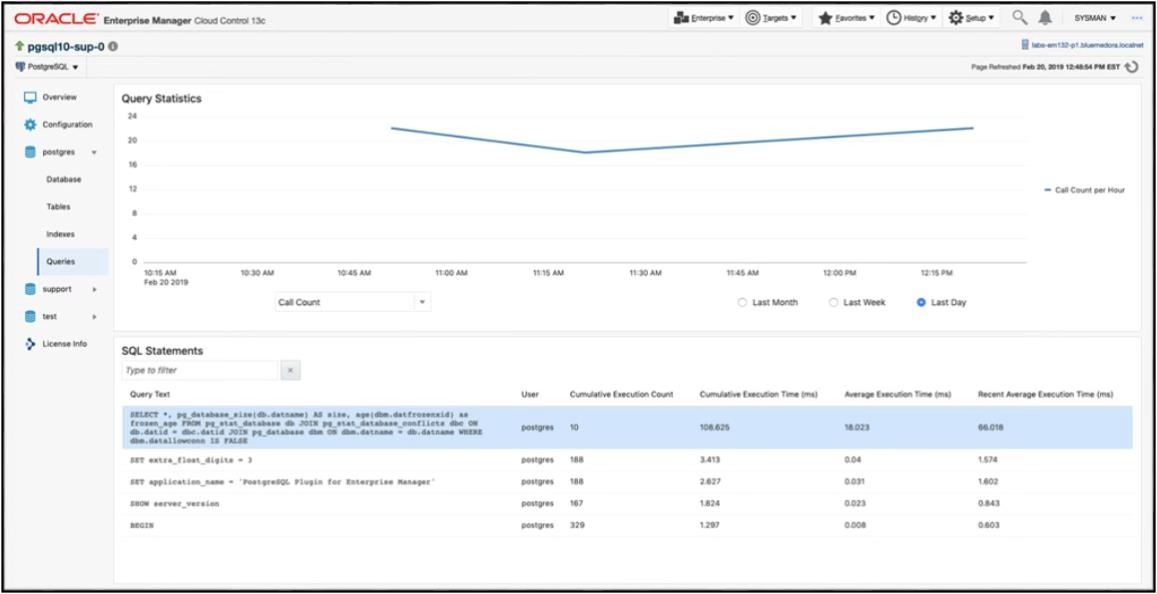
The Queries dashboard surfaces both current and historical query performance, giving DBAs the ability to identify slow queries, track execution plan changes, and correlate query performance with application behavior over time.
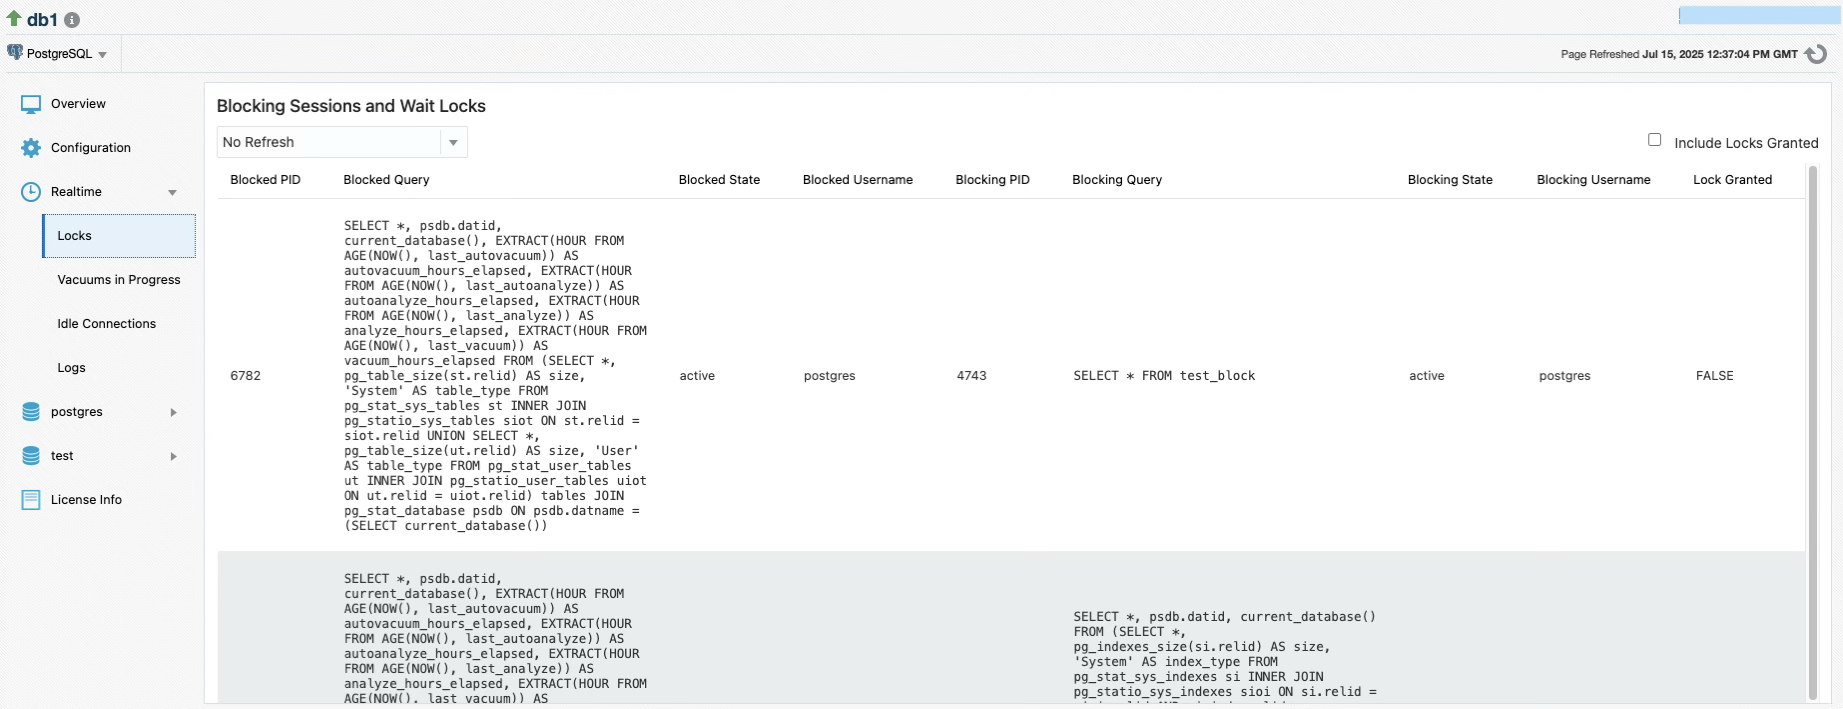
The Real-Time dashboard is where incident responders live during an outage: blocking sessions, active vacuum progress, recent log entries, and idle connection counts — the data you need when every second matters.
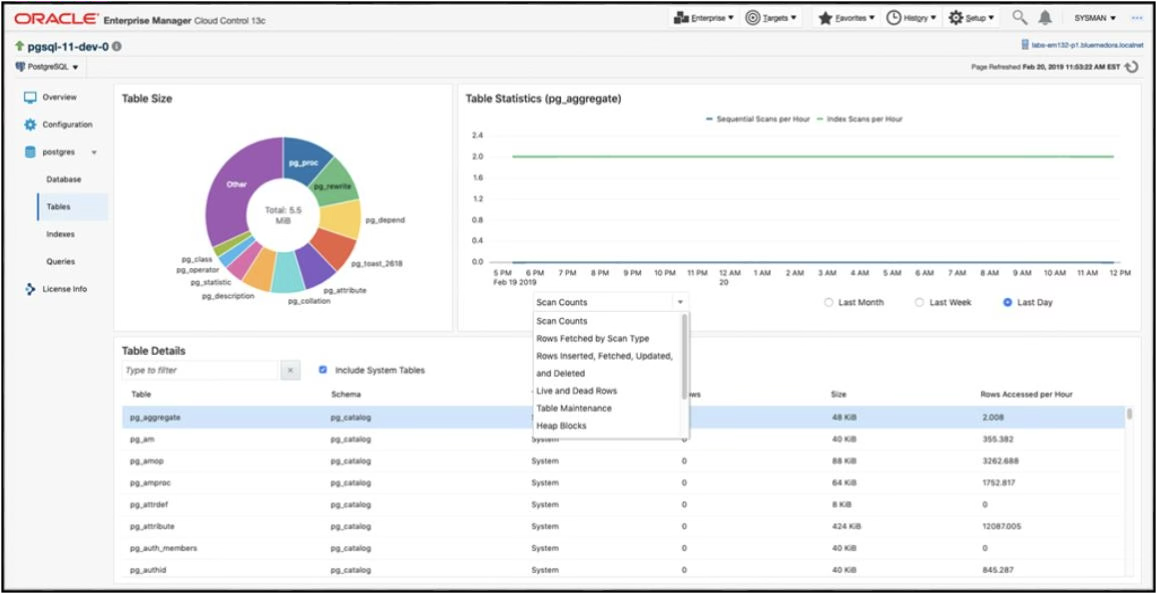
The Tables dashboard monitors table-level health: sizes, sequential vs. index scan ratios, dead tuple accumulation, and growth trends that inform capacity planning and vacuum tuning.
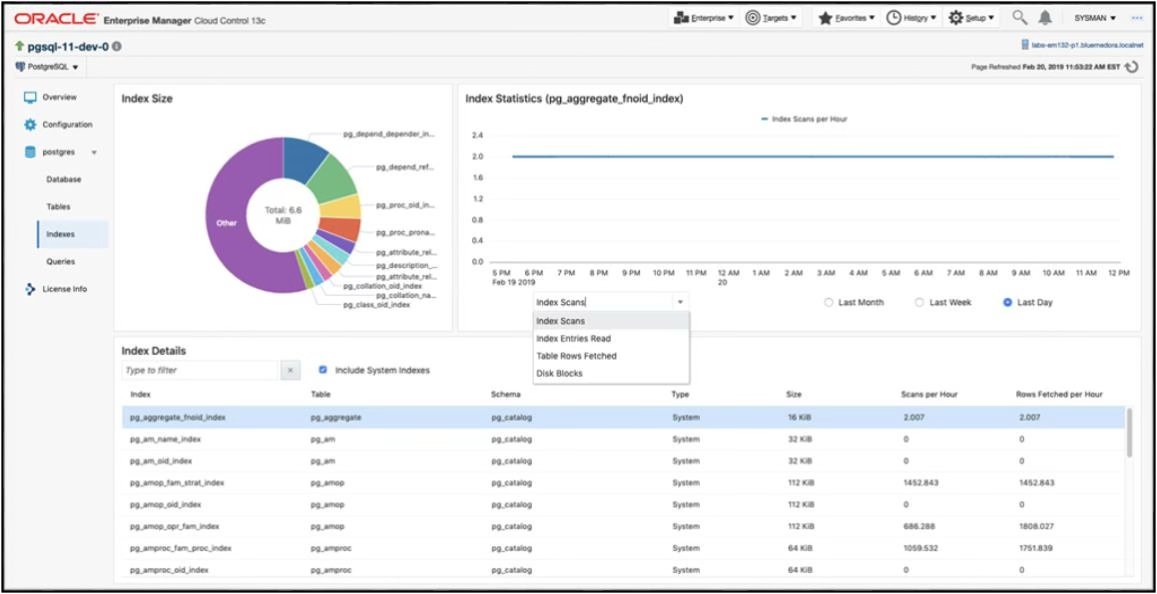
The Indexes dashboard tracks index utilization, identifies unused indexes consuming storage, and provides sizing history that helps DBAs optimize their indexing strategy.
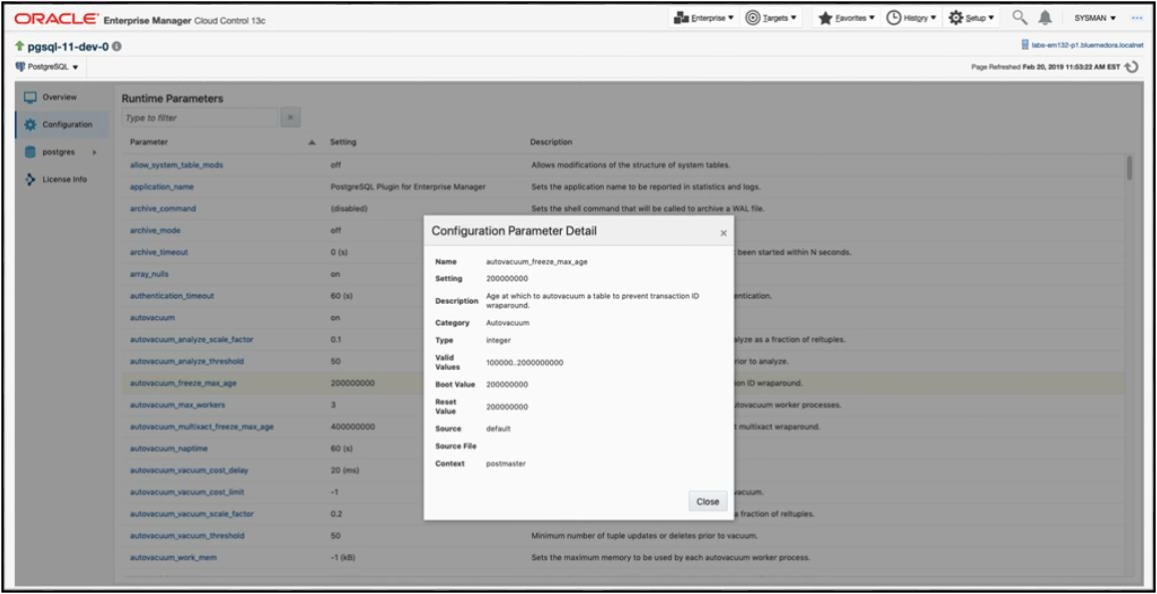
The Configuration dashboard documents current, boot-time, and reset values for every PostgreSQL setting — critical for configuration drift detection and audit compliance.
Query Analyzer with Explain Plans
The plugin includes a built-in query analyzer that lets DBAs execute queries and review explain plans directly within OEM. Wait event visualization helps identify exactly where time is being spent — whether it's CPU, I/O, lock contention, or network latency. For a bank running thousands of instances, the ability to analyze query performance without connecting to individual database hosts eliminates hours of manual diagnostic work.
Patroni Cluster Management from OEM
This is one of the capabilities that decisively tipped the bank's evaluation. The plugin allows operators to initiate Patroni switchovers directly from Oracle Enterprise Manager — no CLI access required, no API calls to script. OEM automatically detects the cluster leader, identifies viable switchover candidates, and executes the switchover through the interface.
For a bank running hundreds of Patroni clusters across time zones, centralized switchover management means planned maintenance happens faster, with less risk, and with a full audit trail in OEM.
Real-Time Blocking Session Detection
When a production transaction starts queuing behind a blocking session, you need to know immediately — not after the application team reports elevated error rates fifteen minutes later. The plugin surfaces blocking sessions in real time, showing which queries are blocked, which session is the blocker, and how long the contention has persisted. DBAs can identify and resolve blocking issues before they cascade into application-level incidents.
Intelligent Alerting Templates
The plugin ships with pre-configured alert templates for the most critical PostgreSQL conditions: replication lag exceeding thresholds, connection pool exhaustion, long-running transactions, deadlocks, and storage capacity warnings. These templates integrate with OEM's existing notification infrastructure — email, PagerDuty, webhooks, SNMP traps — so the bank didn't need to build a separate alerting pipeline for PostgreSQL.
At 2,000+ instances, the ability to deploy standardized alerting policies across the entire fleet from a central console — and know that every instance is covered — is the difference between a monitoring strategy and a monitoring aspiration.
Custom Metric Extensions
Every bank has application-specific metrics that go beyond standard PostgreSQL monitoring. The plugin supports custom SQL-based metric extensions that let DBAs define their own queries to collect business-relevant data — transaction volumes by type, queue depths, processing latencies for specific workflows — and surface that data alongside the built-in metrics in OEM dashboards and alerts.
Unified Monitoring: One Platform, Every Database
The single most important architectural advantage of the plugin is unification. With Oracle Enterprise Manager as the monitoring platform for both Oracle and PostgreSQL, the bank's operations team has one console, one alerting engine, one historical metric store, one compliance reporting framework, and one operational workflow.
During an incident, there's no question about which dashboard to open. During an audit, there's no need to stitch together evidence from multiple platforms. During capacity planning, Oracle and PostgreSQL growth trends sit side by side. This isn't a convenience — at banking scale, it's an operational necessity.
How the Bank Deployed at Scale
The deployment followed a straightforward three-phase approach that the plugin is designed to support:
Phase 1: Install the Plugin. The Integration Plumbers plugin was deployed to the bank's existing Oracle Enterprise Manager environment. Because OEM agents were already installed on the hosts running PostgreSQL (many of which also ran Oracle instances), the plugin deployment required no new infrastructure and no additional agents.
Phase 2: Configure Targets. PostgreSQL instances were added as monitoring targets in OEM with connection details and credentials. OEM's target discovery capabilities accelerated this process — rather than manually configuring 2,000 individual instances, the team used OEM's bulk target provisioning to onboard entire clusters at once.
Phase 3: Start Monitoring. Within days of completing the rollout, the operations team had unified visibility across every PostgreSQL instance in their global infrastructure. Dashboards were live, alerts were firing, and the query analyzer was available for every instance — all through the same OEM console they'd been using for Oracle for over a decade.
The entire deployment — from plugin installation to global monitoring coverage — took weeks, not months. That speed was only possible because the plugin leverages OEM's existing infrastructure rather than requiring a parallel monitoring platform to be built and maintained.
The Results: From Fragmented to Unified
Six months after deploying the Integration Plumbers plugin, the bank's infrastructure team reported measurable improvements across every dimension they were tracking.
Reduced MTTR by 40%. With PostgreSQL and Oracle metrics in a single console, incident responders stopped losing the first thirty minutes of every outage switching between tools. Blocking sessions, replication lag, and query performance issues were identified and resolved faster because the data was already on screen.
Eliminated tool sprawl. Three regional monitoring stacks (Prometheus/Grafana, a commercial APM, and manual scripts) were decommissioned. The engineering headcount that had been maintaining those stacks was redirected to application development and infrastructure modernization.
Satisfied regulatory auditors. When auditors from multiple financial authorities reviewed the bank's database monitoring controls, they found consistent, centralized monitoring with documented alerting policies, historical metric retention, and standardized operational procedures — all managed through Oracle Enterprise Manager. What had previously required weeks of audit preparation was reduced to exporting reports from OEM.
Enabled proactive capacity planning. With historical growth data for every PostgreSQL instance tracked in OEM, the bank moved from reactive storage provisioning (emergency expansions at 95% utilization) to planned quarterly capacity reviews based on trend analysis across their entire fleet.
Reduced licensing costs. By consolidating onto OEM — a platform the bank already licensed — the team avoided the per-host monitoring costs that commercial APM vendors would have charged across 2,000+ instances. The cost avoidance alone exceeded the total investment in the Integration Plumbers plugin within the first year.
How many PostgreSQL instances can the plugin monitor through a single OEM deployment?+
The plugin inherits Oracle Enterprise Manager's proven scalability. OEM is architected to manage tens of thousands of targets from a single deployment, and the PostgreSQL plugin operates within that same framework. Customers are running the plugin across thousands of PostgreSQL instances today. The practical limit is determined by your OEM infrastructure sizing, not by the plugin itself.
Does the plugin support Patroni high-availability clusters?+
Yes. The plugin includes dedicated Patroni cluster management capabilities, including automatic leader detection, candidate identification, and the ability to initiate switchovers directly from the OEM console. This eliminates the need for CLI or API access to Patroni and provides a full audit trail for every switchover event — a critical requirement in regulated environments.
Which PostgreSQL versions are supported?+
The plugin supports PostgreSQL versions 14 through 18, covering both current production releases and the latest version. It is compatible with Oracle Enterprise Manager Cloud Control 13c (13.5.0.0.0+) and OEM 24ai (24.1.0.0.0+), running on Linux 64-bit and Windows 64-bit agent platforms.
How does the plugin help with regulatory compliance for financial institutions?+
The plugin provides several compliance-relevant capabilities: centralized monitoring with documented alerting policies, historical metric retention for audit evidence, configuration drift detection through the Configuration dashboard, and standardized operational procedures managed through OEM. Because everything is managed in a single platform, audit preparation is significantly faster than when monitoring is fragmented across multiple tools.
Can we extend the plugin with custom metrics specific to our applications?+
Yes. The plugin supports custom SQL-based metric extensions that allow DBAs to define their own queries for collecting application-specific data. These custom metrics are fully integrated into OEM's dashboards, alerting, and historical data retention — so they receive the same treatment as the 200+ built-in metrics.
Ready to Monitor PostgreSQL at Enterprise Scale?
If you're running PostgreSQL alongside Oracle — whether it's fifty instances or five thousand — the Integration Plumbers' PostgreSQL Plugin for Oracle Enterprise Manager gives you unified visibility, enterprise-grade alerting, and the operational simplicity that comes from managing everything in a single platform.
No other PostgreSQL monitoring solution can match the scale that OEM provides. And no other plugin brings PostgreSQL into OEM with the depth of metrics, dashboards, and management capabilities that Integration Plumbers delivers.
Let's show you what unified database monitoring looks like at your scale.