Introduction
If you run Tintri VMstore appliances, you know the story all too well: rich per-VM storage metrics are available in the Tintri portal, but the moment you want to correlate a storage spike with an application alert — or roll those metrics into the same Grafana dashboard your SRE team already watches — you hit a wall. Everyone on the team ends up in a different tool, stitching together context manually, and the on-call engineer is the one left holding the pieces at 2 a.m.
This post walks through three topics:
- The storage observability gap that motivated this project
- How the receiver is architected — the two-tier collection model, components, and metric design
- How to configure and run it, and what you get out of the box
If you'd rather see the collector in action first, our team walked through the problem, the architecture, and a live demo in the webinar Integrating Tintri Data Management into Your OpenTelemetry Pipeline. This post is the written companion for teams who want to go deeper on the internals and the configuration model.
Key Terms
VMstore: A Tintri all-flash storage appliance that presents per-VM storage analytics through a REST API (v3.10 in the version this receiver targets).
TGC (Tintri Global Center): Tintri's fleet-management plane. TGC maintains an inventory of VMstore appliances and enriched topology metadata (datastore names, datacenter assignments).
OTLP (OpenTelemetry Protocol): The standardized wire protocol for transmitting metrics, traces, and logs between OTel components. The receiver exports metrics via OTLP to any OTLP-compatible backend.
Receiver: In OpenTelemetry Collector terminology, a component that acquires telemetry from an external system and emits it into the Collector's internal pipeline.
Gauge: An OTel metric instrument for values that can go up or down (IOPS, latency, capacity used). All metrics emitted by the receiver are gauges.
1. The Storage Observability Gap
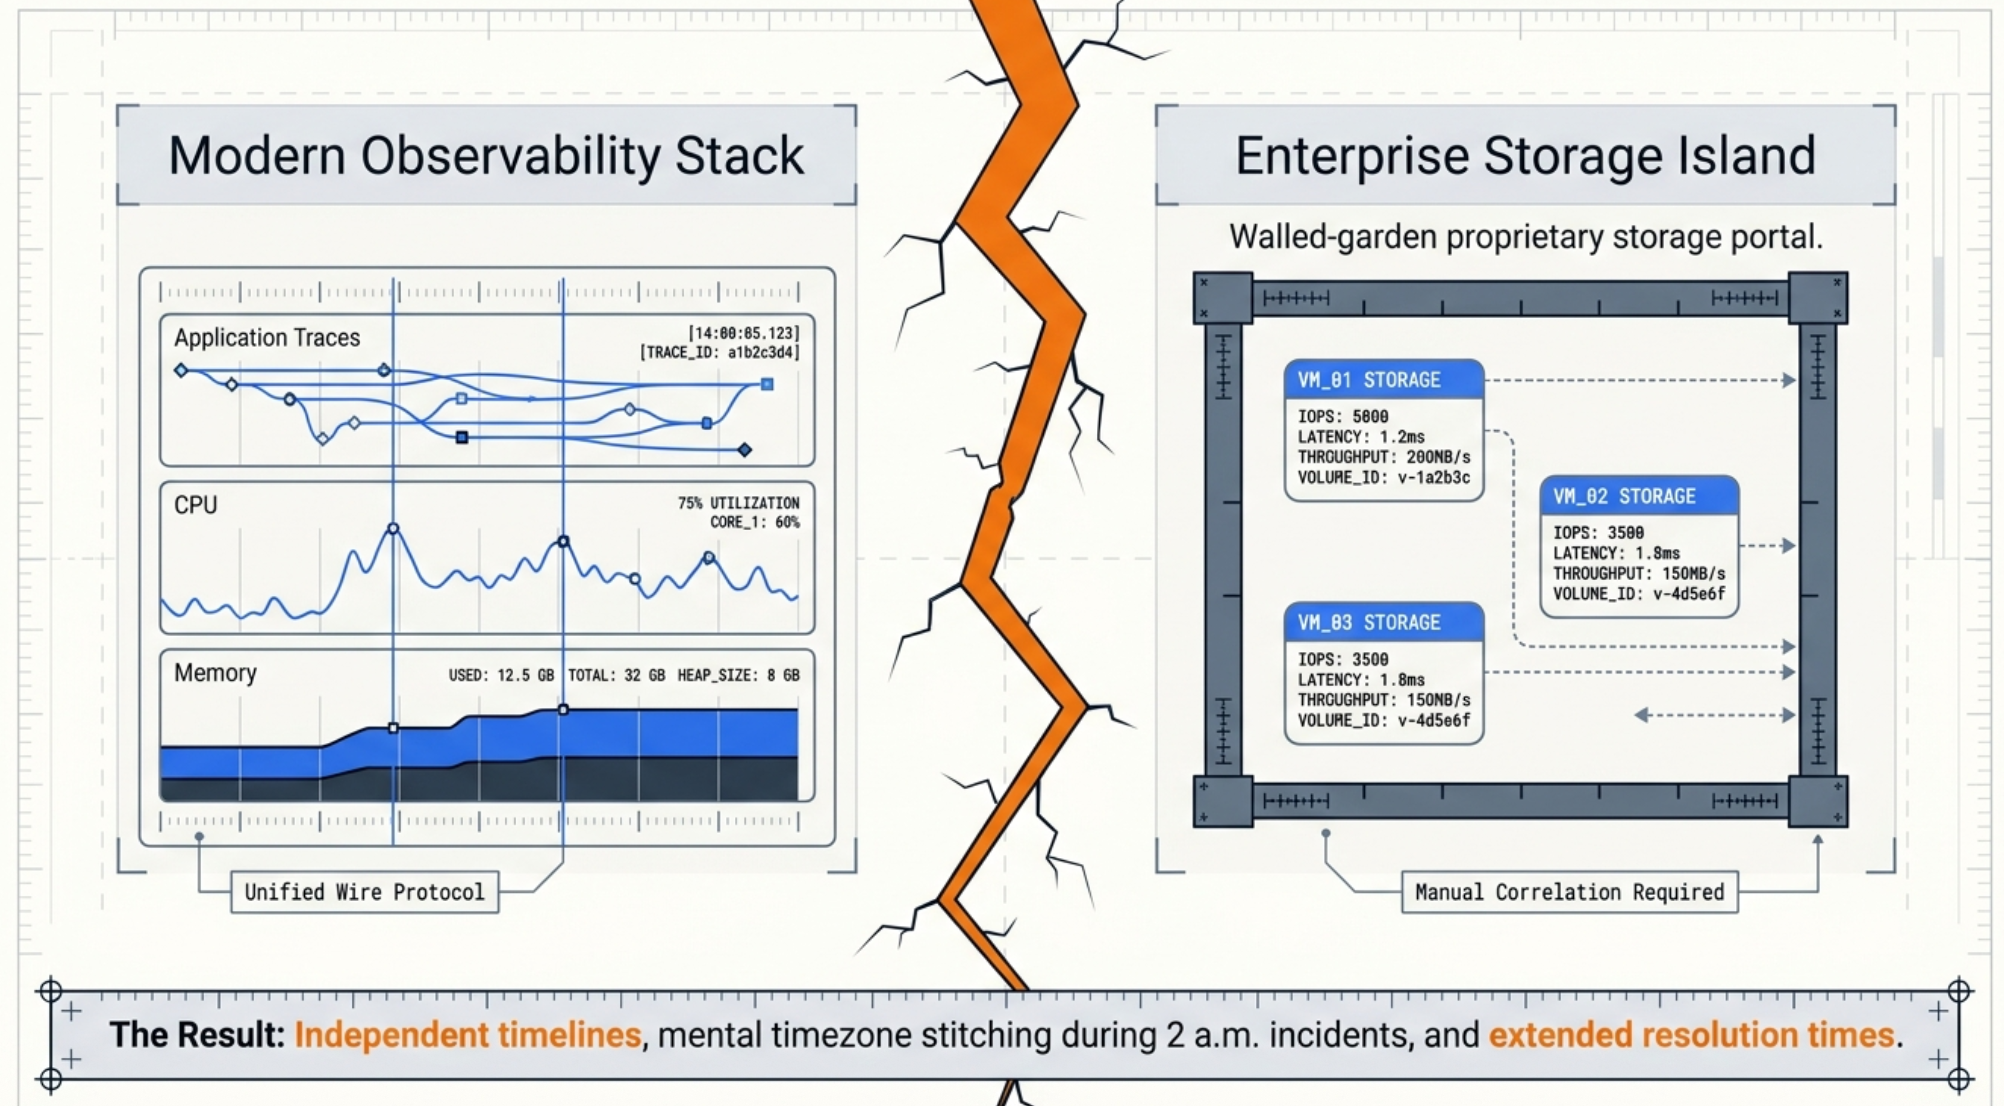
Modern observability platforms — Prometheus, Grafana, the OpenTelemetry Collector, vendor APM tools — have largely converged on a common data model and wire protocol. But storage systems, particularly enterprise NAS and all-flash appliances, often predate that convergence. Tintri is no exception: VMstore appliances expose a rich REST API with per-VM, per-datastore, and per-VDISK statistics, but no native OpenTelemetry or Prometheus endpoint.
The practical consequence is that storage metrics live in a silo. Teams correlating a VM latency spike with an upstream service degradation must switch between Tintri's management console and their observability stack, mentally joining two independent timelines. At scale — with dozens of VMstore appliances managed through a Tintri Global Center (TGC) — this becomes an operational burden that accumulates quietly until it causes an extended outage.
We wrote about this class of problem — and the organizational work required to solve it — in The Observability Blind Spots: Why Your Storage Infrastructure Is Invisible to OpenTelemetry. That post covers the strategic framing. This post is the implementation.
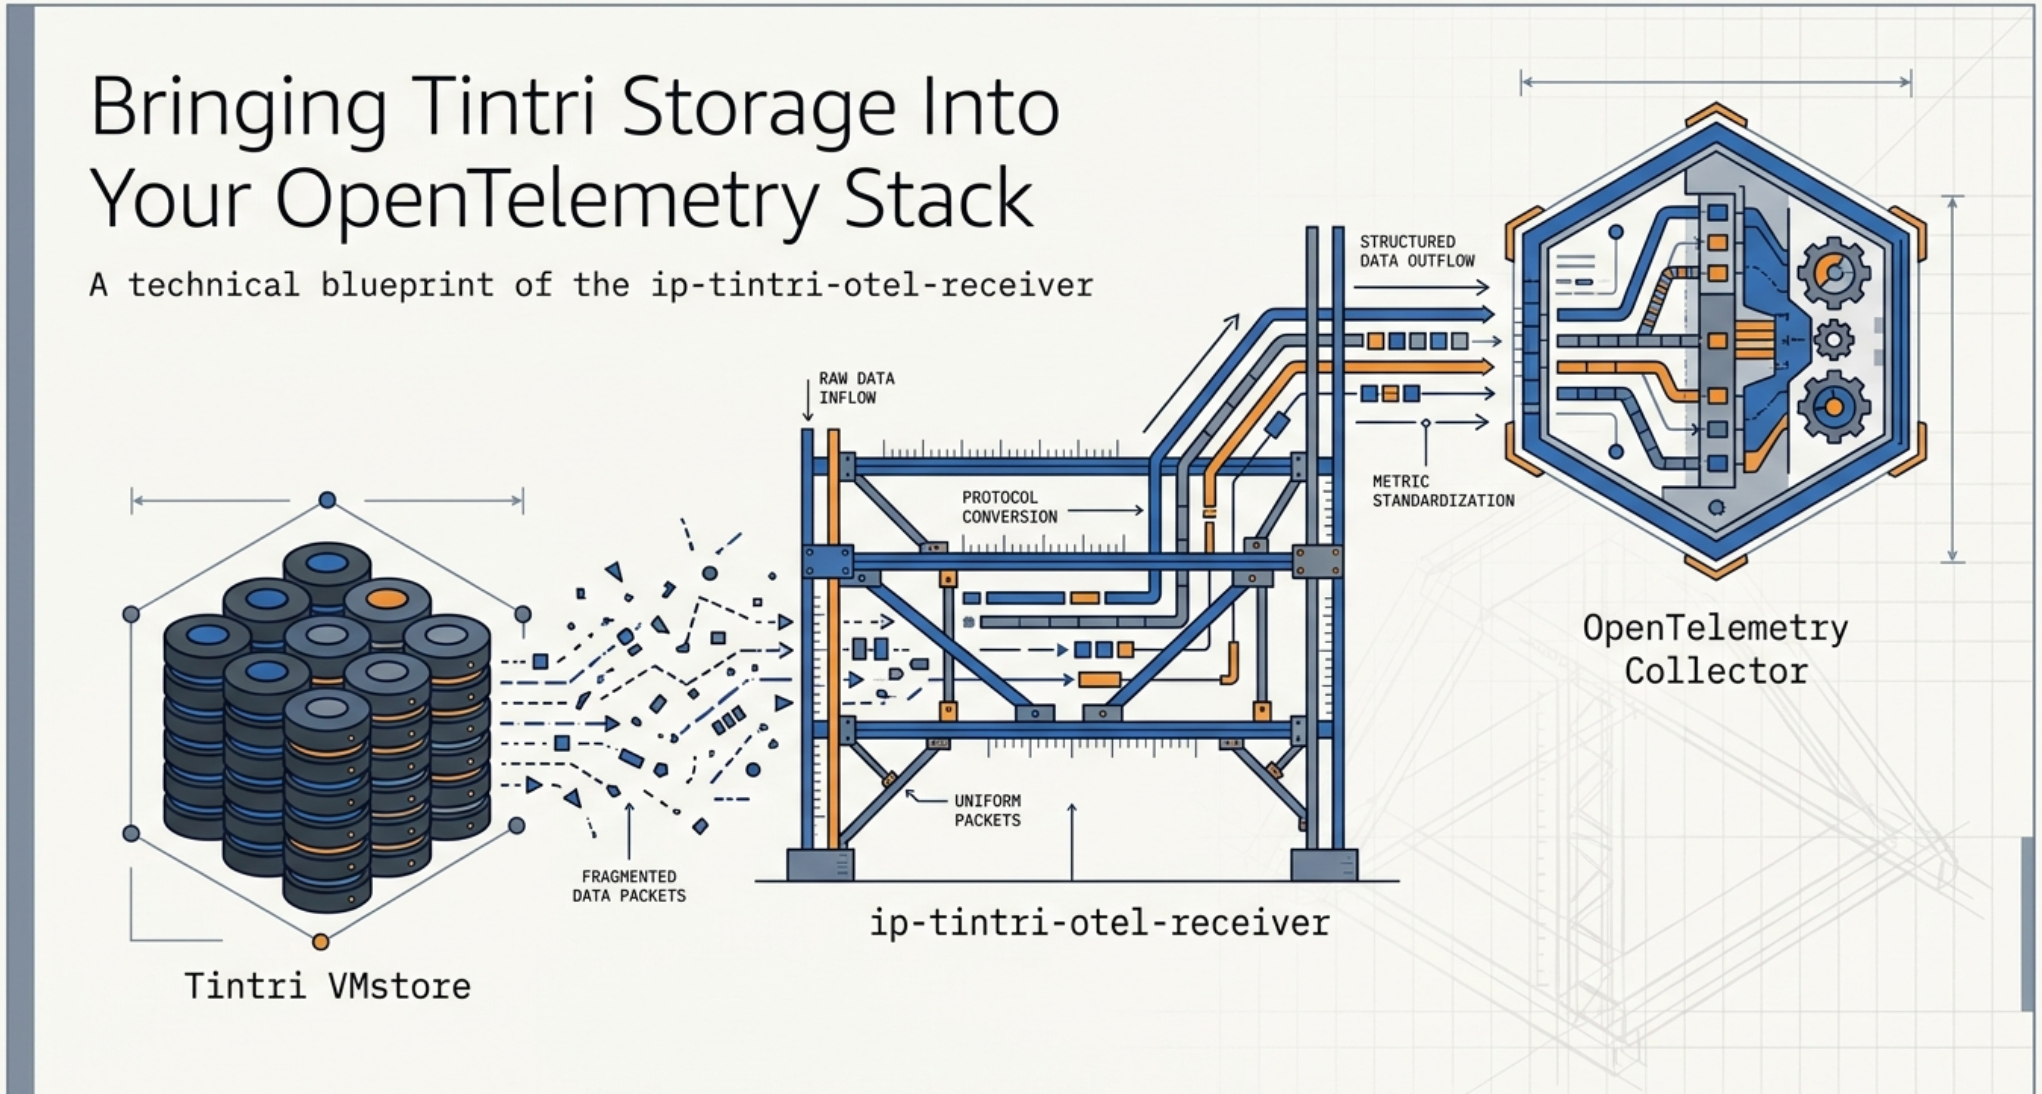
The ip-tintri-otel-receiver closes the gap. Once deployed, Tintri metrics flow through the same OTel Collector pipeline as application traces and infrastructure metrics, enabling unified dashboards, unified alerting, and unified retention policies — with no custom export scripts to maintain.
2. Architecture: The Two-Tier Collection Model
Tintri's infrastructure naturally separates into two API tiers with very different characteristics, and the receiver's architecture mirrors that separation directly.
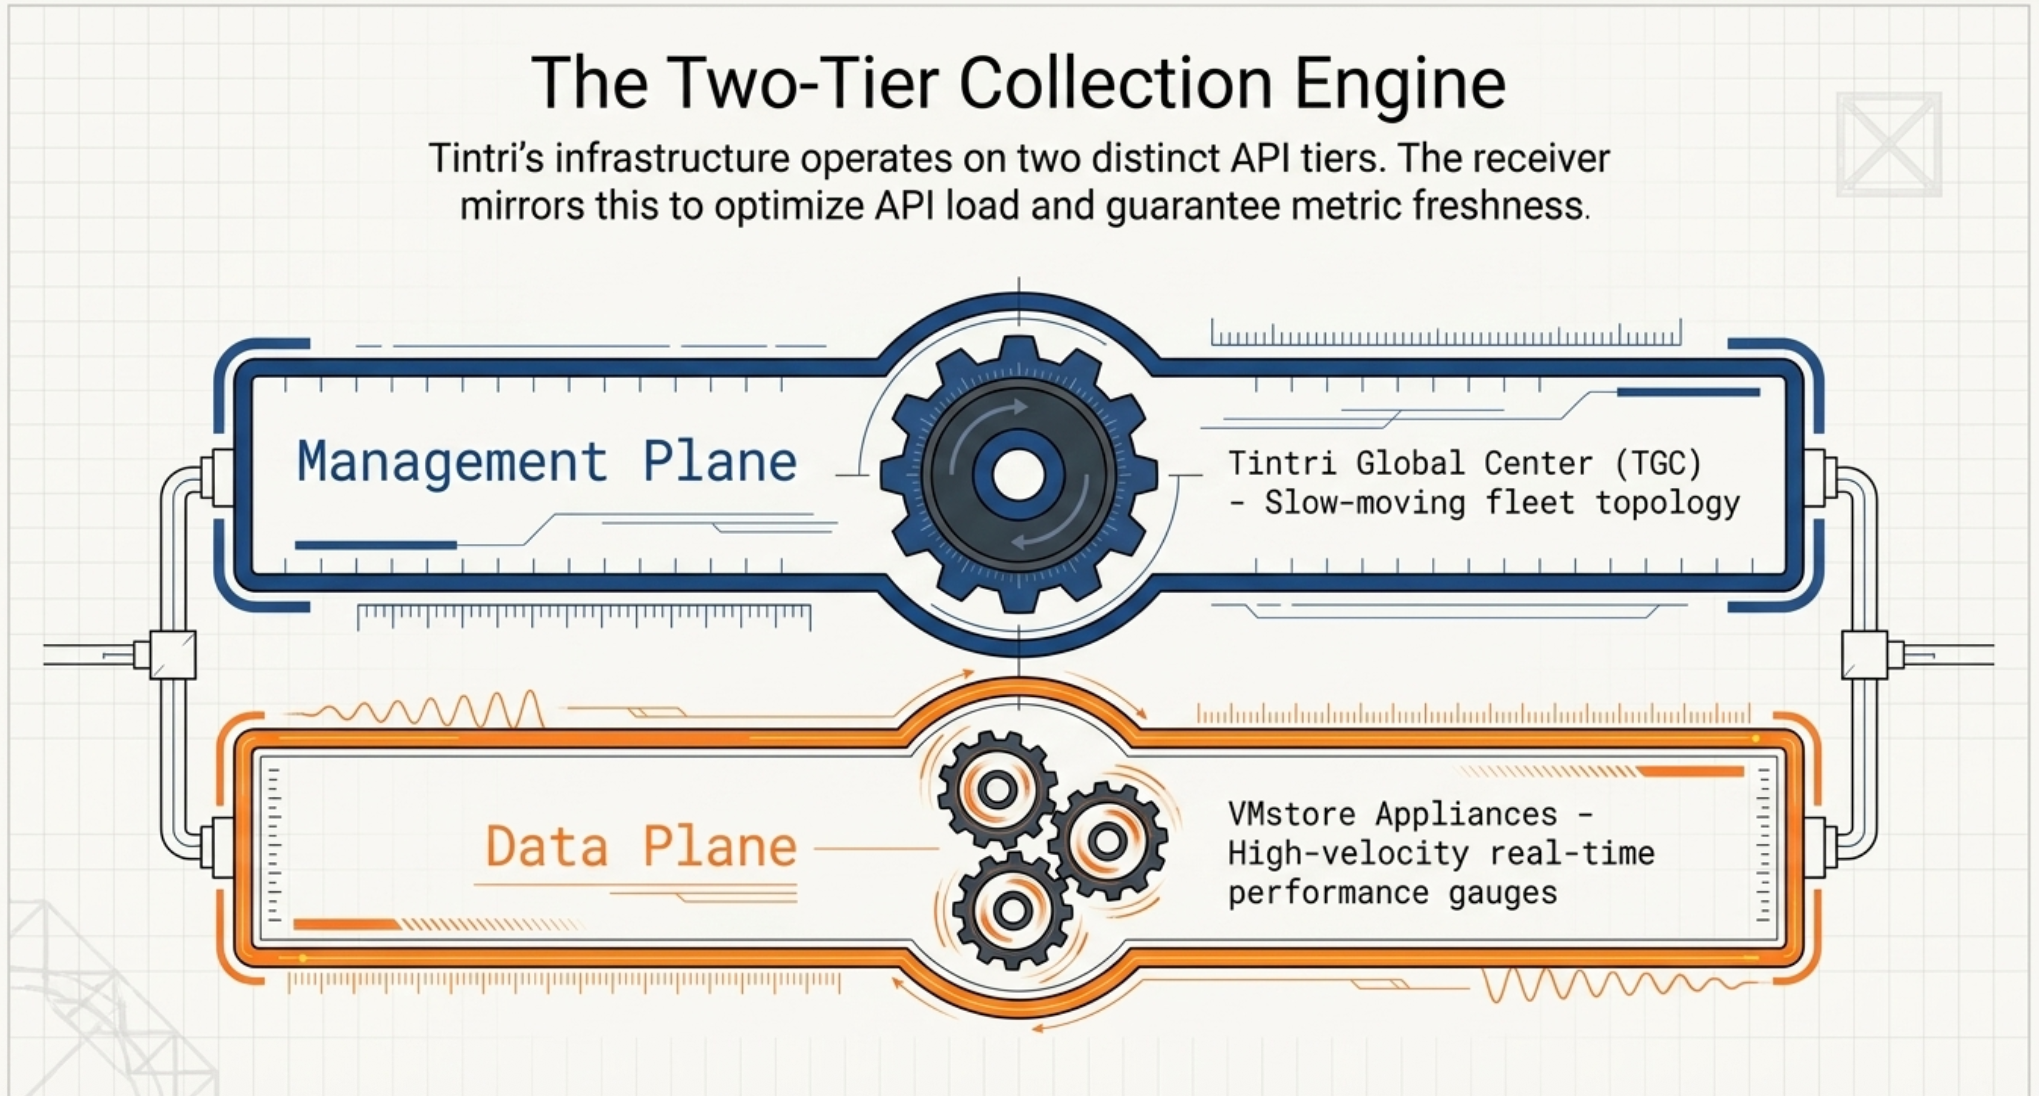
2.1 The TGC Tier (Slow Path: 5–15 Minutes)
Tintri Global Center is the management plane. It exposes a fleet-wide inventory via GET /vmstore, which returns topology data: which VMstore appliances exist, their UUIDs, datacenter assignments, and enriched attributes. This data changes slowly — new appliances get provisioned infrequently — so it is polled on a long interval (default 5 minutes).
The TGC tier is handled by two components:
tgc_client.py— a session-authenticated REST client that calls the TGC API.tgc_inventory.py— a background thread that periodically refreshes the cached inventory.
Crucially, this cache provides attribute enrichment for every metric: without TGC, a VM metric carries only its UUID; with TGC, it also carries the datastore name, VMstore hostname, and datacenter. This means TGC is optional — the receiver degrades gracefully and continues collecting metrics if TGC is unavailable, just without the enriched attributes.
2.2 The VMstore Tier (Fast Path: 30–60 Seconds)
Individual VMstore appliances are the data plane. Each exposes real-time performance statistics via endpoints like /datastore/{uuid}/statsRealtime, /vm, and /virtualDisk. These endpoints return current-state gauges — IOPS, latency, throughput, capacity utilization — and are polled on a short interval.
The VMstore tier is handled by two components per appliance:
vmstore_client.py— a session-authenticated REST client for VMstore API v3.10 with retry logic and configurable timeouts. This client deliberately never calls/vmstore(that endpoint belongs to TGC only).vmstore_collector.py— the per-appliance orchestrator. It calls the four collection methods (system, datastores, VMs, VDISKs), uses the TGC inventory cache when available to resolve datastore UUIDs, and falls back to a directGET /datastorecall when TGC is not present.
2.3 The Metric Pipeline
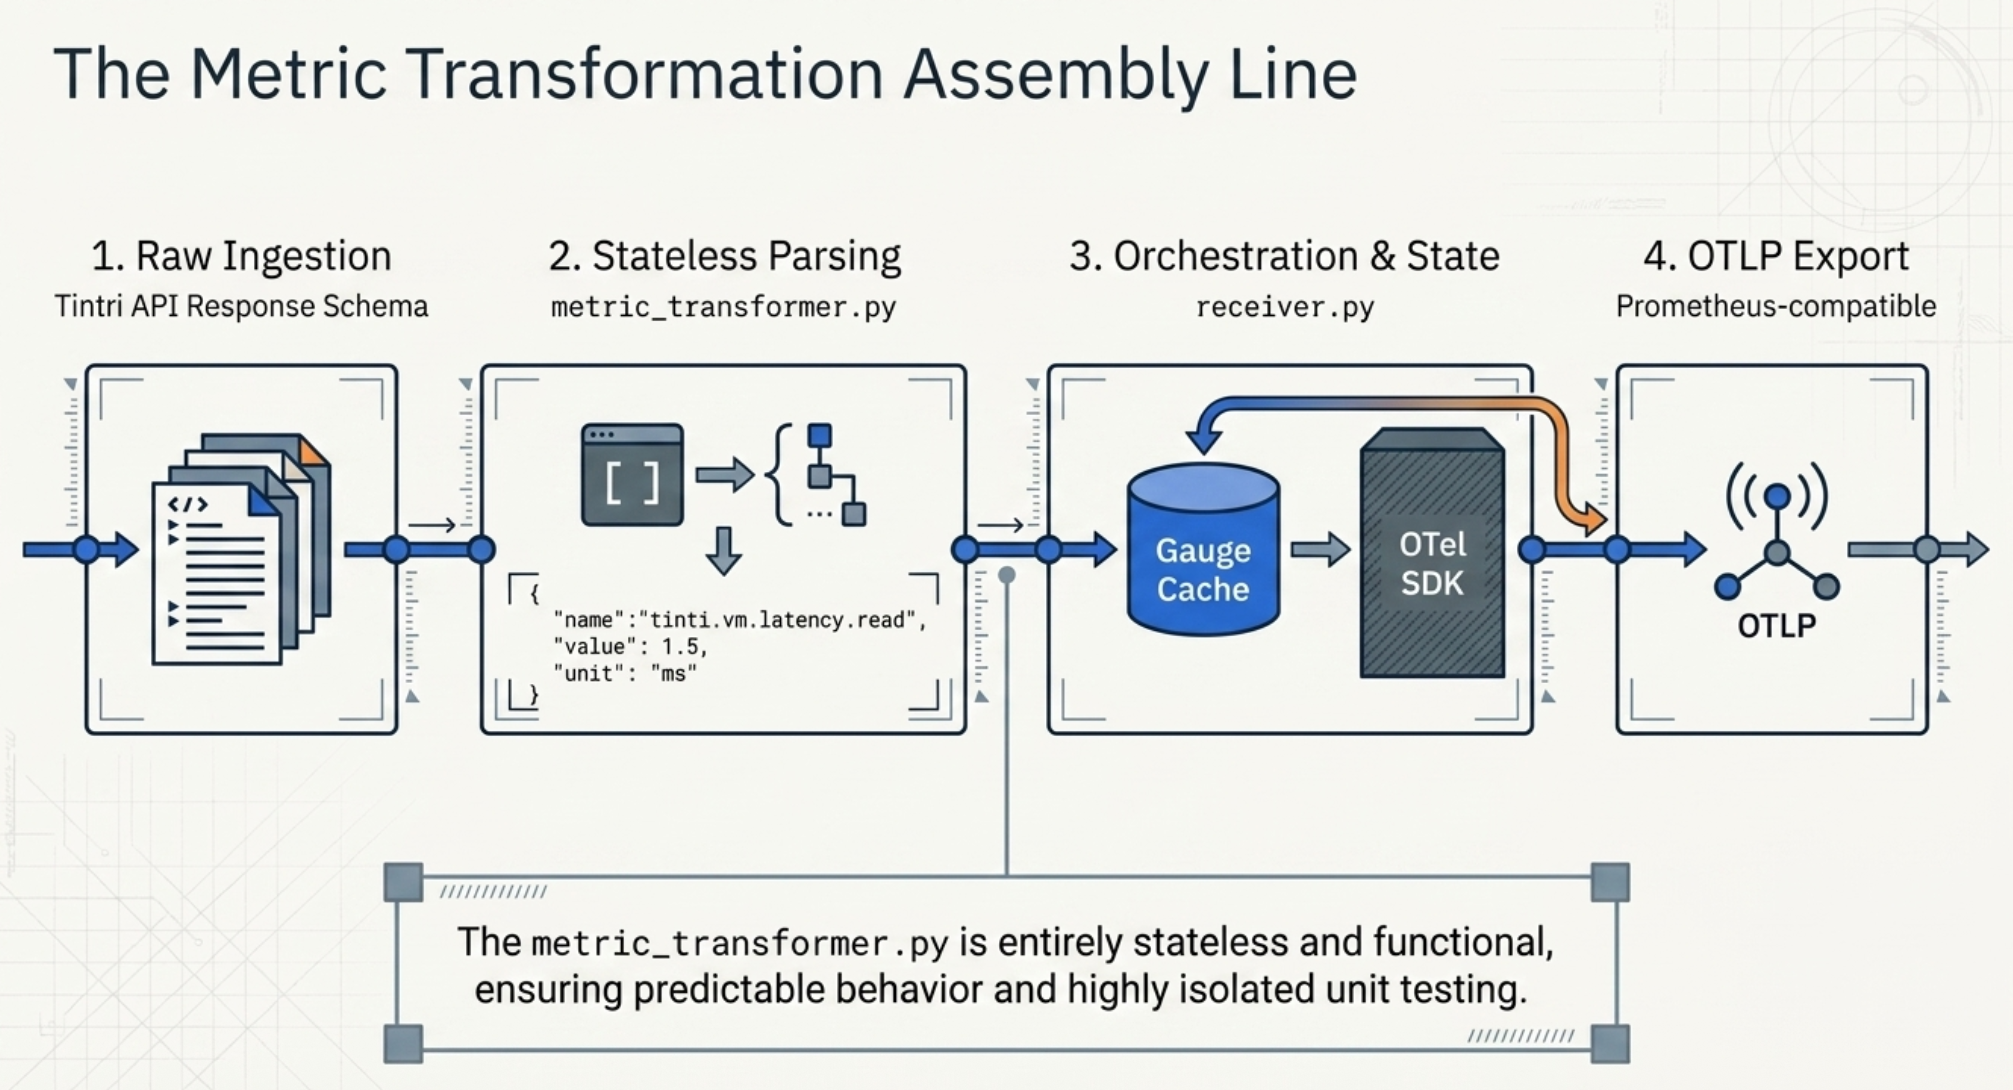
Once raw API responses are collected, they pass through two more layers before becoming OTel metrics:
metric_transformer.py contains static methods that parse Tintri's API response schemas and produce a simple internal metric dict:
{
  "name": "tintri.vm.latency.read",
  "value": 1.5,
  "unit": "ms",
  "attributes": { "vm.uuid": "...", "datastore.name": "..." }
}
The transformer is purely functional — no state, no side effects — which makes it easy to unit test in isolation. It covers over 150 named fields across datastores, VMs, VDISKs, replication stats, capacity, and savings factors.
receiver.py is the top-level orchestrator. It instantiates the OTel MeterProvider and PeriodicExportingMetricReader, manages one collection thread per VMstore appliance, and exports via OTLP (defaulting to a Prometheus-compatible OTLP endpoint). Gauges are cached in a dict keyed by metric name to avoid recreating OTel instruments on every collection cycle — instrument creation is not free.
2.4 Key Design Decisions
A few choices in the implementation are worth calling out explicitly:
| Decision | Rationale |
|---|---|
| Threading, not asyncio | Each VMstore gets a dedicated thread with a simple stop-event loop. This avoids async complexity while still collecting appliances concurrently, and isolates failures — one slow appliance won't block others. |
| TGC is optional | Many deployments manage VMstores directly without TGC. Making TGC optional means the receiver can be adopted incrementally without requiring full fleet management infrastructure. |
| Gauge cache | OTel instruments are created once and reused. Instrument creation allocates state inside the SDK; recreating on every scrape cycle introduces unnecessary overhead and can cause SDK warnings. |
| VDISK capacity off by default | VDISK-level capacity calls are slower and produce high metric cardinality. Opt-in keeps the default footprint light for teams that don't need that granularity. |
| Health status encoded as int | String health states (HEALTHY, WARNING, CRITICAL) are mapped to 0/1/2 so they can be used in Prometheus alerting rules and Grafana thresholds without additional transforms. |
2.5 What Metrics Does It Collect?
The receiver emits metrics across four entity types. All metric names follow the tintri.<entity>.<category>.<field> naming convention.
| Metric Name | Description | Unit |
|---|---|---|
tintri.datastore.latency.total_ms | End-to-end datastore I/O latency | ms |
tintri.datastore.iops.read | Datastore read operations per second | ops |
tintri.datastore.throughput.write | Datastore write throughput | MB/s |
tintri.datastore.flash.hit_percent | Percentage of I/Os served from flash | % |
tintri.datastore.capacity.used_percent | Capacity utilization (computed) | % |
tintri.datastore.savings.dedupe_factor | Deduplication savings factor | — |
tintri.vm.latency.read | Per-VM read latency | ms |
tintri.vm.iops.total | Per-VM total IOPS | ops |
tintri.vm.cpu.percent | Per-VM CPU utilization | % |
tintri.vm.memory.usage_mib | Per-VM memory usage | MiB |
tintri.vm.capacity.used | Per-VM capacity consumed | GiB |
tintri.vdisk.latency.read | Per-VDISK read latency (opt-in) | ms |
tintri.datastore.health.status | Health state (0=OK, 1=Warn, 2=Critical) | — |
Note: Replication statistics (incoming and outgoing throughput, bytes remaining, time remaining) are also collected as nested sub-metrics on both datastores and VMs when replication is configured.
3. Getting Started
The receiver is installed via Python's uv package manager and runs as a standalone process or as a sidecar alongside the OTel Collector.
3.1 Installation
# Install from source
uv pip install -e .

# Install with dev dependencies (for running tests)
uv pip install -e ".[dev]"
3.2 Configuration
Configuration is a YAML file with a receivers.tintri block. Passwords support ${env:VAR_NAME} substitution so credentials stay out of config files.
receivers:
  tintri:
    tgc:                          # Optional — omit if no TGC
      endpoint: https://tgc.example.com
      username: admin
      password: ${env:TGC_PASSWORD}
      collection_interval: 300s   # 5-minute inventory refresh

    vmstores:
      - endpoint: https://vmstore-01.example.com
        username: admin
        password: ${env:VMSTORE_01_PASSWORD}
        collection_interval: 60s
        collect_system: true
        collect_datastores: true
        collect_vms: true
        collect_vdisks: true
        vdisk_capacity_collection: false  # opt-in for VDISK capacity

exporters:
  prometheus:
    endpoint: localhost:9090       # OTLP/HTTP target
3.3 Running the Receiver
# Validate config (dry-run, no connections made)
tintri-receiver --config config.yaml --validate

# Run
tintri-receiver --config config.yaml
On startup the receiver authenticates to TGC (if configured), authenticates to each VMstore, and starts the collection threads. Metrics are exported via OTLP every 10 seconds by default. Each OTLP POST is logged with the metric count and data point count, making it easy to verify the pipeline is flowing.
3.4 Tuning Collection
A few configuration choices have a direct impact on performance and cardinality:
- VDISK capacity collection is off by default because it requires an additional API call per VDISK and dramatically increases metric cardinality in environments with many virtual disks. Enable only if you need per-VDISK capacity trending.
- Collection intervals are configured per-VMstore. In environments where some appliances serve latency-sensitive workloads, you can shorten their interval without affecting others.
- System-level metrics collection is present in the code but currently commented out in the collector while the aggregation logic is finalized. Datastore, VM, and VDISK collection are fully active.
Closing Thoughts
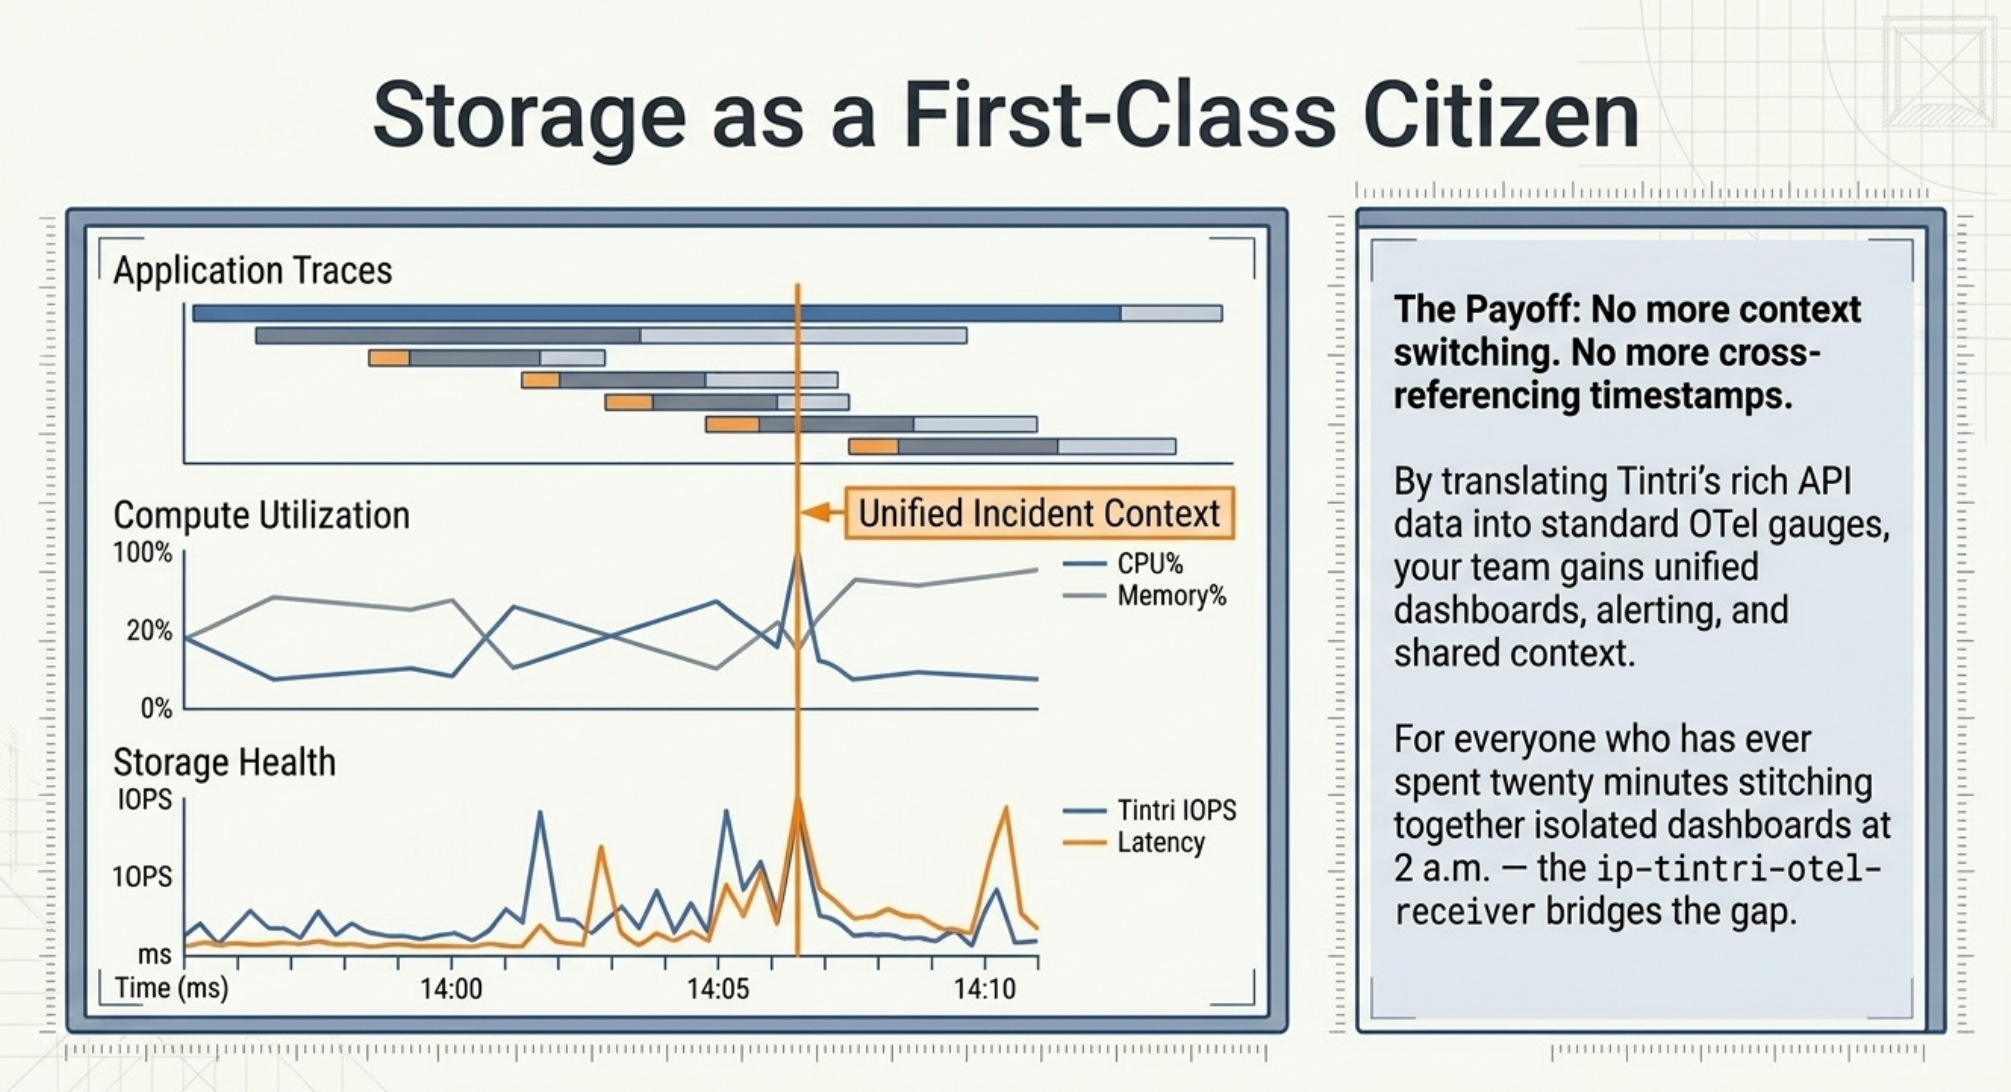
The ip-tintri-otel-receiver makes a straightforward bet: the best place to debug a storage-related incident is the same observability platform your team already uses, not a dedicated vendor portal. By translating Tintri's rich API data into standard OTel gauges, it lets teams build storage dashboards and alerts alongside their existing infrastructure and application monitoring — with no new tooling to learn and no custom export scripts to maintain.
For the on-call engineer, this means having storage IOPS, latency, and capacity utilization on the same screen as CPU and memory metrics when an alert fires. For the platform team, it means storage is a first-class citizen in their Grafana, Prometheus, or vendor APM stack. And for everyone who has ever spent twenty minutes cross-referencing timestamps between two dashboards at an inconvenient hour — this one's for you.
Next Steps
- Watch the walkthrough. If you haven't already, the Integrating Tintri Data Management into Your OpenTelemetry Pipeline webinar covers the same material with a live demo and a joint Q&A from the Tintri and Integration Plumbers engineering teams.
- Deploy alongside the OTel Collector and connect to Prometheus/Grafana for immediate dashboarding.
- Open issues or PRs on the ip-tintri-otel-receiver repo — system metrics and alert collection are the two most logical extensions.
- Browse the project repo at github.com/IntegrationPlumbers/ip-tintri-otel-receiver for the full source, configuration reference, and test suite.
Do I need Tintri Global Center (TGC) to use this receiver?+
No. TGC is optional. If it's configured, the receiver uses it to enrich every metric with human-readable context — datastore names, VMstore hostnames, datacenter assignments — by caching the fleet inventory on a 5-minute refresh. Without TGC, the receiver still authenticates to each VMstore directly and continues collecting metrics; you just lose the enriched attributes, and datastore UUIDs are resolved via a direct GET /datastore fallback. This makes the receiver suitable for both fleet-managed and standalone VMstore deployments.
Does this add meaningful load to my VMstore appliances?+
In practice, no. The VMstore tier polls read-only performance endpoints (/datastore/{uuid}/statsRealtime, /vm, /virtualDisk) on a configurable interval that defaults to 30–60 seconds. Each VMstore gets a dedicated collection thread with its own session, so one slow appliance never blocks others, and failures are isolated per-appliance. If you do want to reduce load further, you can raise the per-VMstore collection_interval, turn off VDISK collection (off by default), or opt out of VM-level collection entirely on appliances where you only need datastore-level metrics.
How much metric cardinality should I expect, and how do I control it?+
Cardinality is primarily a function of how many VMs and VDISKs you're collecting. A single datastore emits roughly a dozen gauges; each VM adds another handful; each VDISK (if enabled) adds more. The biggest cardinality lever is vdisk_capacity_collection, which is off by default — enabling it requires an additional API call per VDISK and can push cardinality into the hundreds of thousands of series in large environments. For most teams, collecting datastore + VM metrics and leaving VDISK collection at its default provides the right balance between visibility and backend cost. If cardinality is a concern for your specific backend, we wrote about the tradeoffs in Taming the Data Explosion: Cardinality in OpenTelemetry.
Can I send metrics directly to Prometheus or a vendor backend without running the full OTel Collector?+
Yes. The receiver exports via OTLP/HTTP, which is a standard wire protocol supported directly by Prometheus (via the remote-write-compatible OTLP receiver), Grafana Cloud, Datadog, New Relic, Honeycomb, and essentially every modern observability backend. Running the full OTel Collector as an intermediate hop is optional — it becomes valuable when you want to batch, filter, transform, or fan out metrics to multiple backends, but for a simple "Tintri → Prometheus" pipeline, the receiver can export directly.
What happens when a VMstore or TGC is temporarily unreachable?+
The receiver degrades gracefully rather than failing hard. If TGC is unreachable, the inventory cache simply goes stale — metrics keep flowing from each VMstore, just without the enriched attributes, and the cache refresh retries on its normal interval. If a single VMstore is unreachable, its dedicated collection thread logs the failure and retries on the next cycle; the other appliances in the fleet are unaffected. The vmstore_client.py layer has retry logic and configurable timeouts tuned for transient network issues, and every OTLP export is logged with its metric count and data-point count so you can spot gaps quickly in the receiver's own logs.
Ready to Bring Storage Into Your Observability Pipeline?
If you're running Tintri (or any enterprise storage platform) that's still invisible to your observability stack, we can help you close that gap — whether that means deploying this receiver, building a similar one for another vendor, or designing the end-to-end dashboards that make storage metrics actionable.
At Integration Plumbers, we specialize in custom OpenTelemetry collectors for infrastructure that doesn't have off-the-shelf instrumentation.
Let's make your storage a first-class citizen in your observability platform.