Part 1 of 2. Part 2 covers building and operating the pipeline.
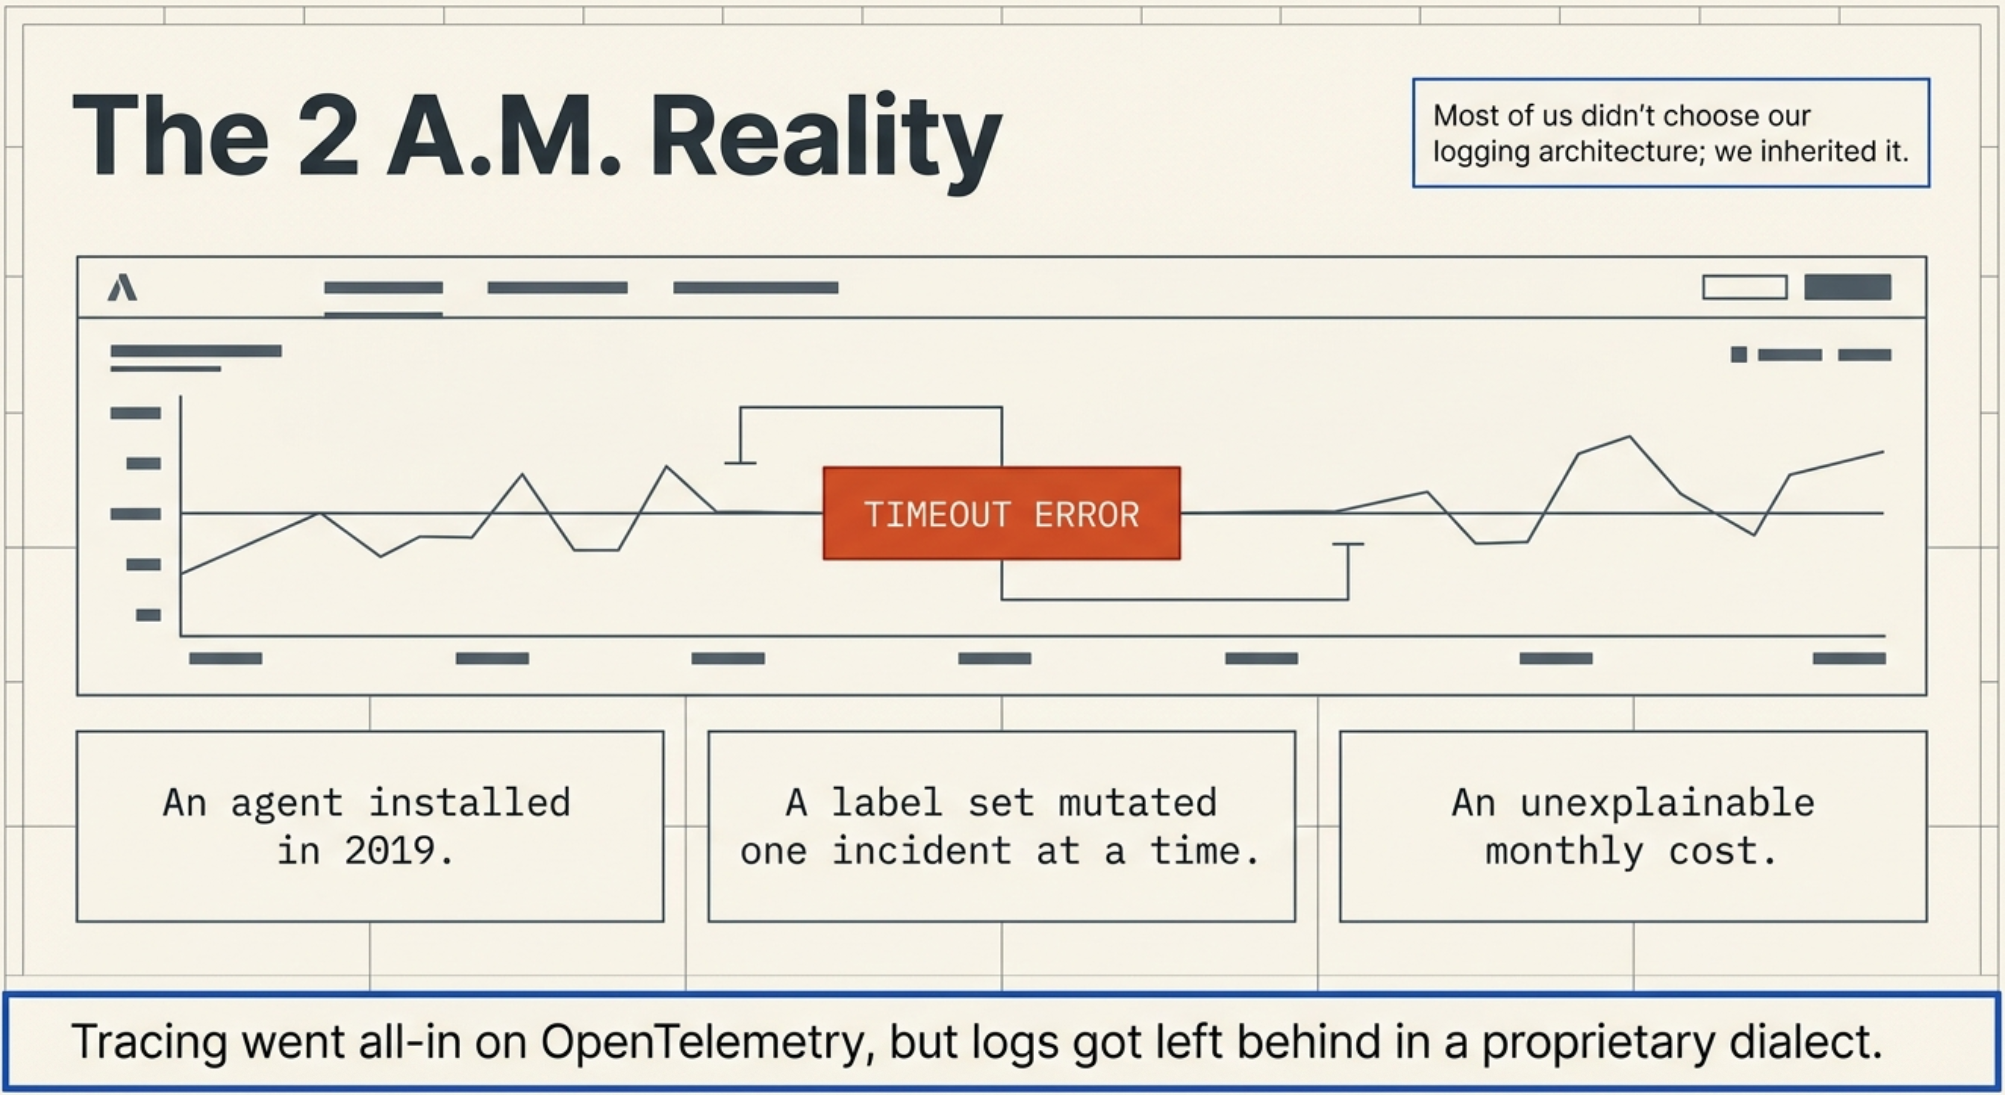
If you have ever opened a log query at 2 a.m. and watched it time out, you already know the problem this series is about. Most of us did not choose our logging architecture so much as inherit it: an agent someone installed in 2019, a label set that grew one incident at a time, and a monthly bill that nobody can fully explain. Meanwhile the tracing side of the house went all-in on OpenTelemetry, and logs got left behind as the one signal still speaking a proprietary dialect.
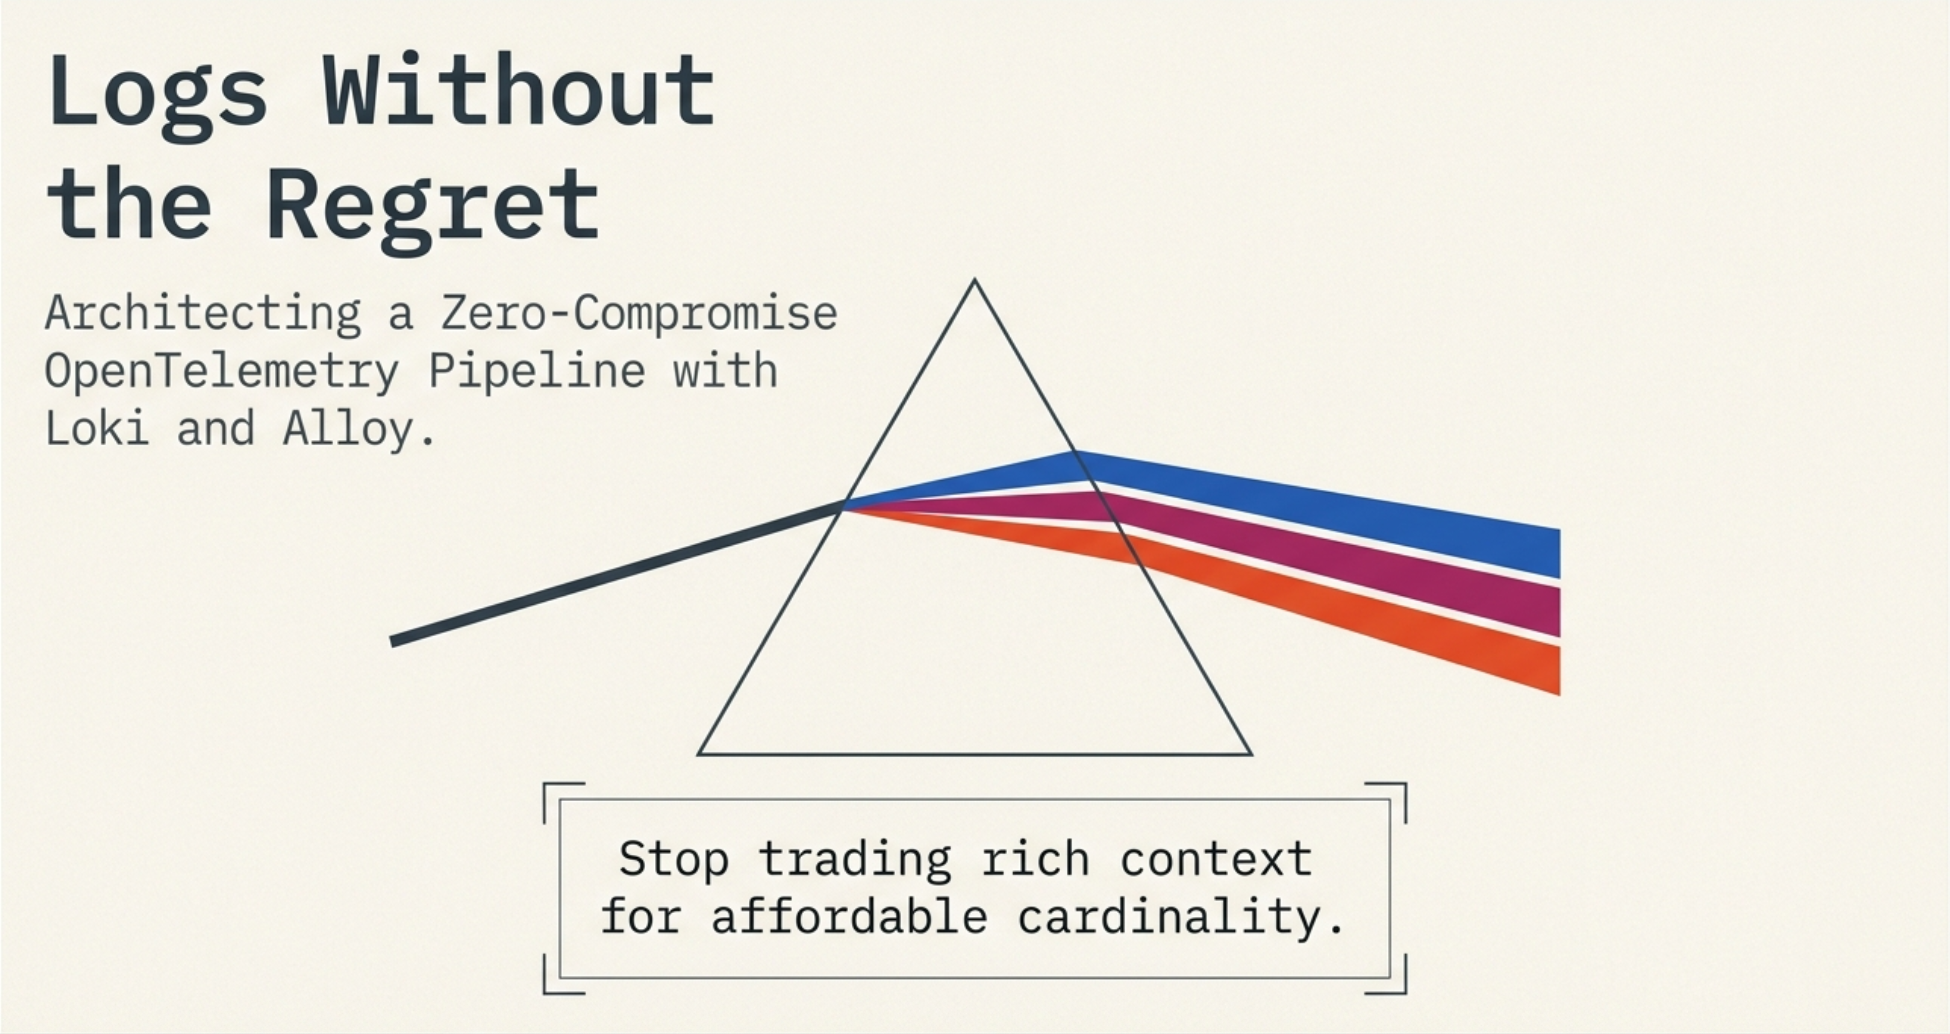
Here is the bottom line: OpenTelemetry logs, Grafana Loki, and Grafana Alloy now form a coherent stack in which you no longer have to choose between rich, queryable log context and affordable cardinality. Loki's native OTLP endpoint changed the economics by splitting your log data into two tiers, a small set of indexed labels and an unlimited set of structured metadata, and Alloy gives you a programmable place to decide which is which before the data ever lands. Getting that split right is the single highest-leverage decision in the whole pipeline.
This first post covers three things: why traditional log pipelines break at scale, what Loki's native OTLP support actually changes, and where Alloy fits and why you still want a collector tier. Part 2 is the hands-on half, building the pipeline, shaping data in flight, and operating it in production.
1. Why traditional log pipelines break at scale
The failure mode is almost never storage volume. It is index cardinality.
Loki's design bet, from the beginning, was to index only a small set of labels and keep the log body itself as compressed, unindexed chunks. A stream is one unique combination of label values. Two labels with ten values each produce one hundred streams. Add a third label with five hundred values, say a pod name in a cluster with aggressive autoscaling, and you have fifty thousand streams. Each one carries its own index entry and its own chunk lifecycle. The index that was supposed to be cheap becomes the most expensive thing in the system, ingesters spend their memory holding thousands of partially filled chunks, and queries slow down because the query planner has more streams to fan out across than actual data to read.
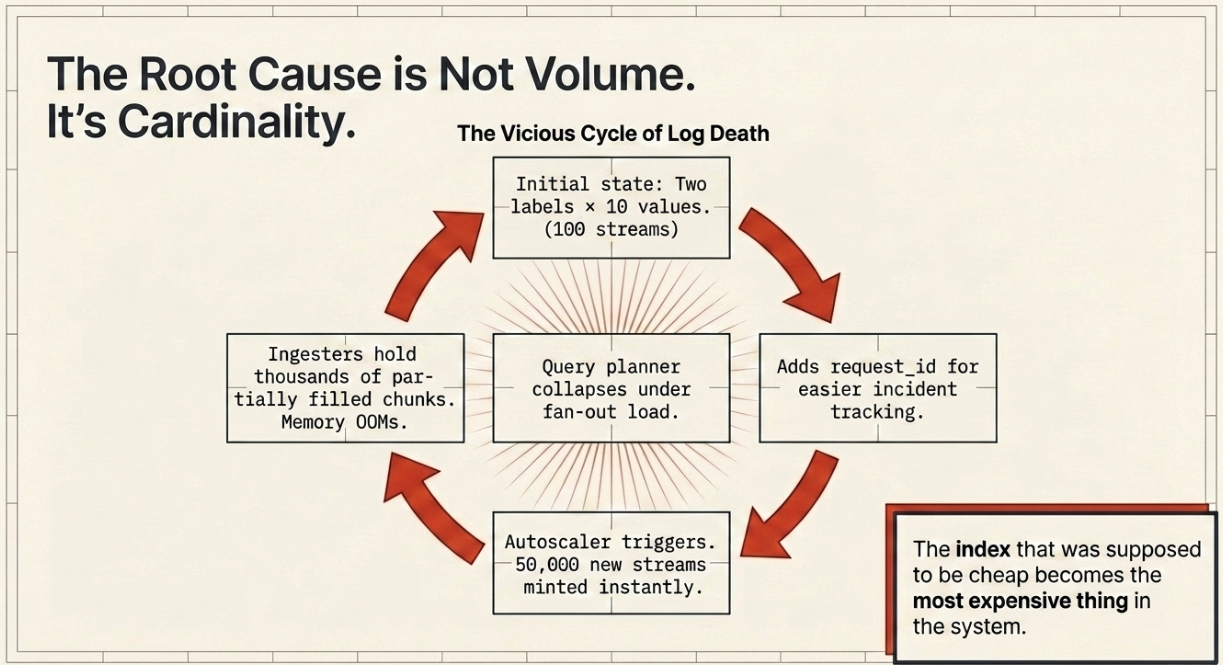
Teams hit this in a predictable order. First someone adds pod as a label to debug a specific instance. Then someone adds request_id because it made one investigation easier. Then the ingesters start OOMing, and the fix is a policy document nobody reads.
The older integration path made this worse rather than better. The now-deprecated Loki exporter in the OpenTelemetry Collector took the entire log record, body and log attributes and resource attributes alike, and encoded it into a JSON or logfmt blob, relying on hint attributes set upstream to decide which fields became labels. That produced two bad outcomes at once. Label selection lived in the instrumentation layer, far from the people who owned the cost of the index. And because everything else was flattened into a blob, every query needed a parser stage to get it back out:
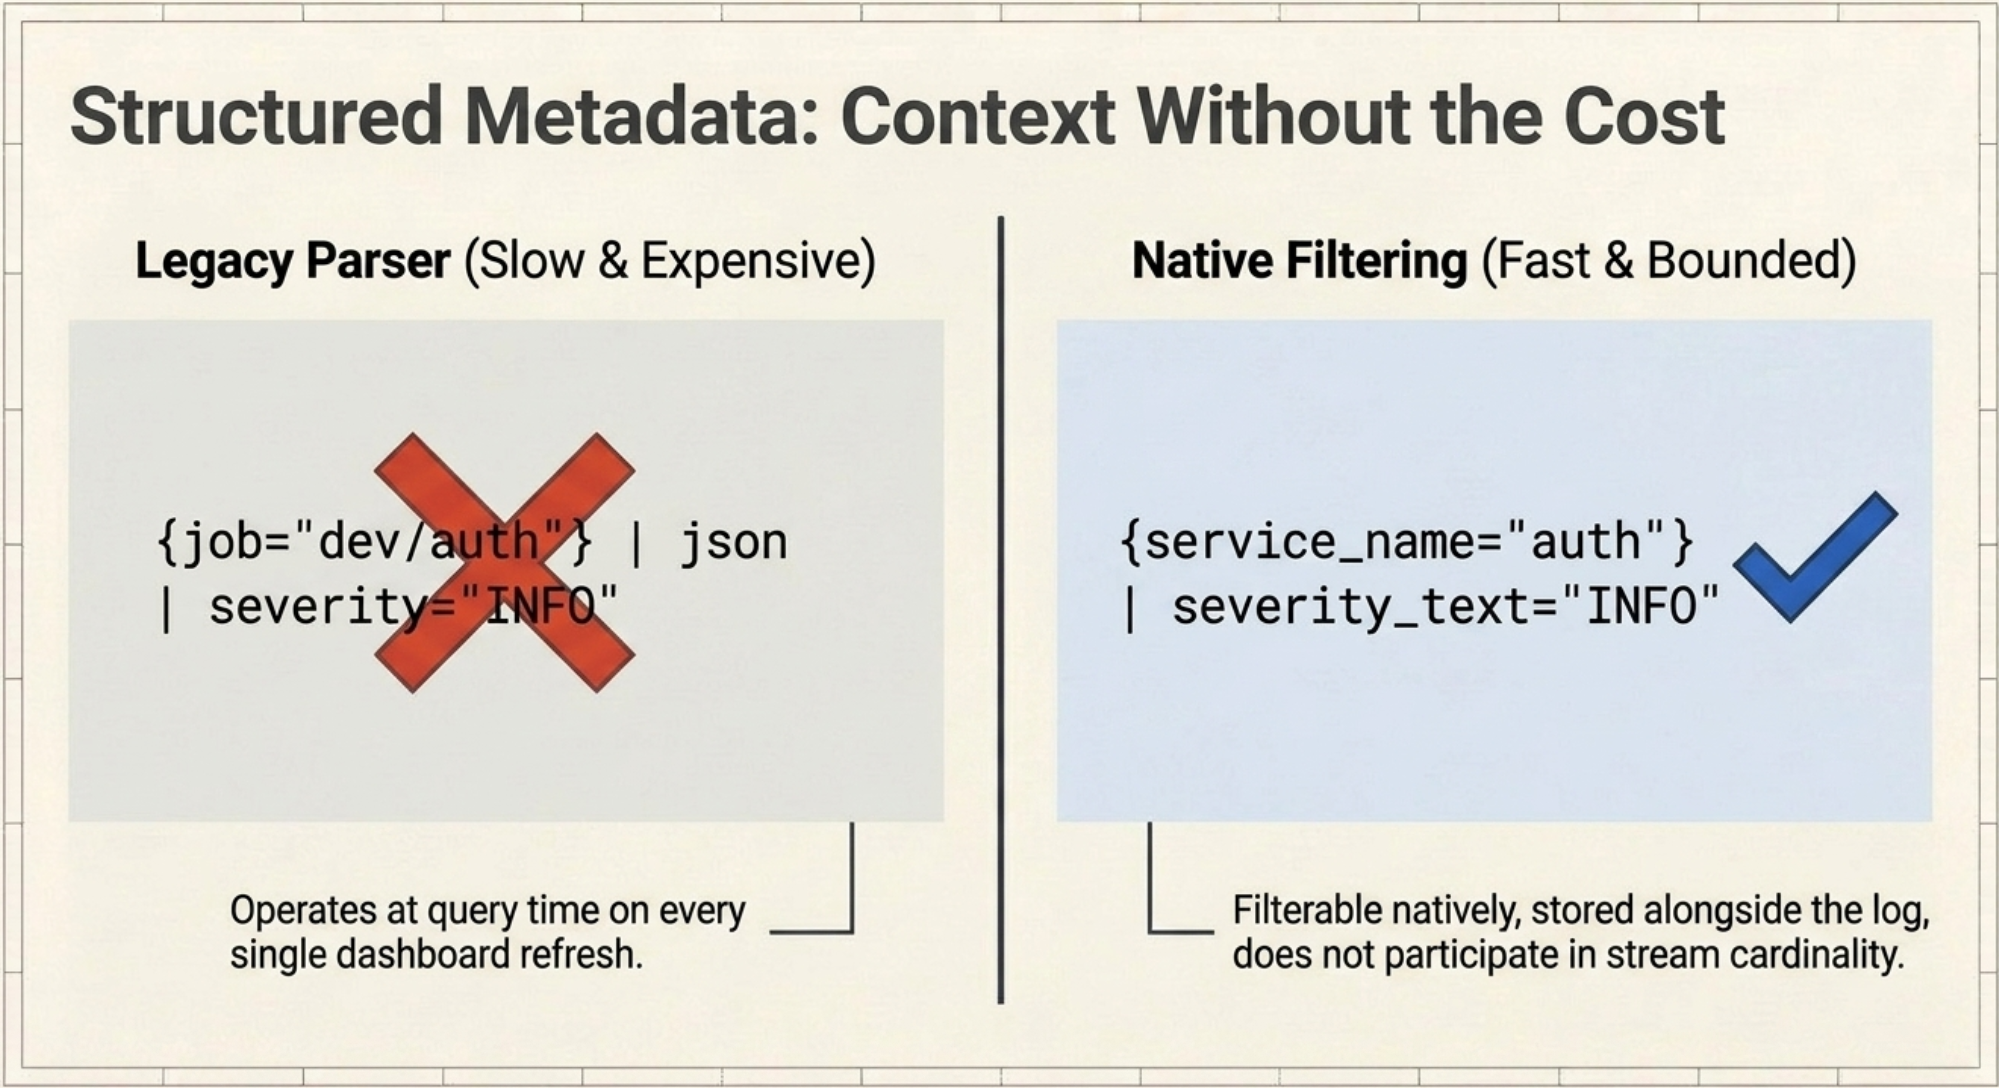
{job="dev/auth"} | json | severity="INFO"That | json is not free. It runs at query time, over every log line the label selector matched, on every dashboard refresh and every alert evaluation. For the on-call engineer, it is the difference between a query that returns while you are still thinking about the problem and one that returns after you have already given up and started grepping a pod's stdout directly.
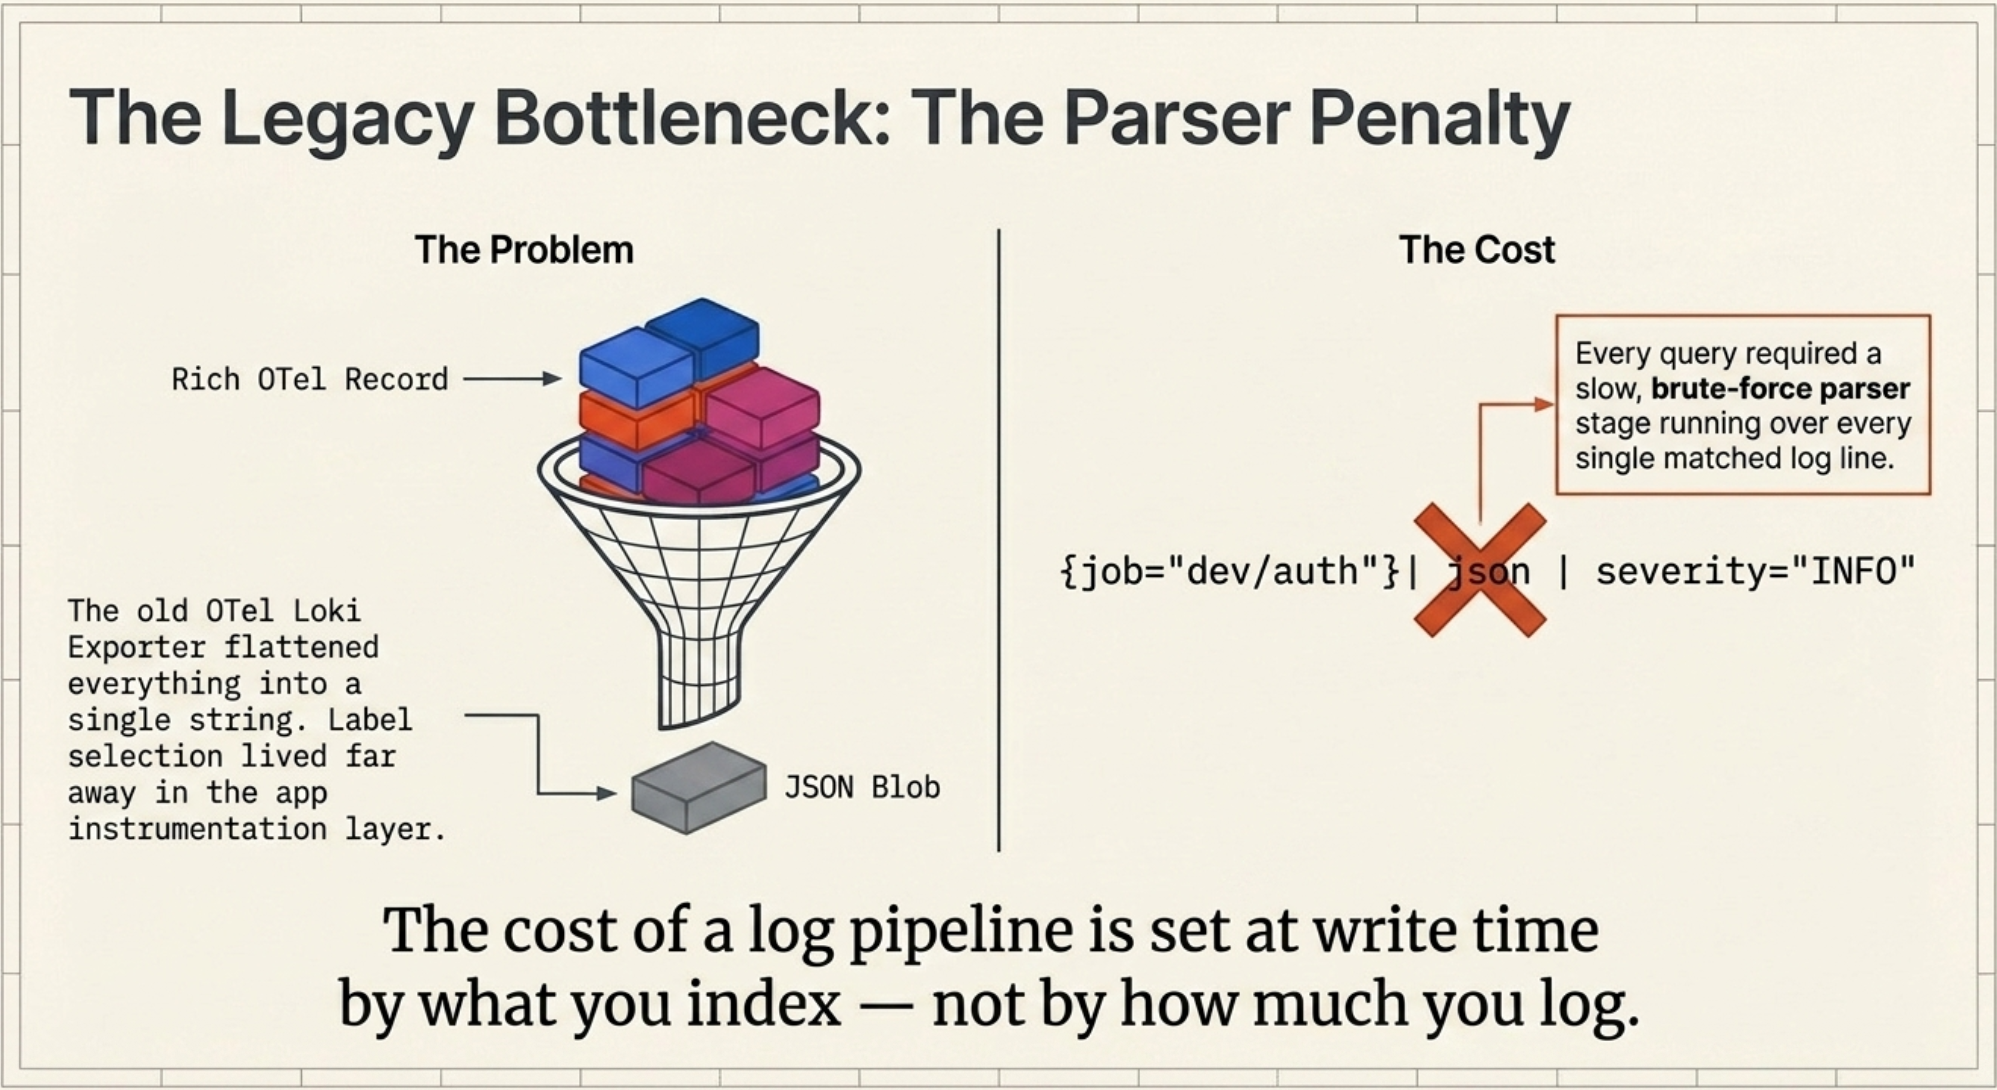
The core idea to carry forward: the cost of a log pipeline is set at write time, by what you chose to index, not by how much you logged.
If that framing sounds familiar, it is the same economics we walked through for metrics in Taming the Data Explosion. Cardinality is one problem wearing different clothes across all three signals.
2. What Loki's native OTLP support actually changes
Loki 3.0 introduced a native OTLP ingestion endpoint, and it reframes the problem in a way that is genuinely different rather than merely more convenient.
You send OTLP straight to Loki at the /otlp path, so http://loki:3100/otlp for the otlphttp exporter, which appends /v1/logs itself. No format translation, no exporter-specific encoding. What arrives is what you emitted.
On the receiving side, Loki fans each log record into three destinations:
- The log line is the stringified
LogRecord.Body. - A curated set of resource attributes becomes indexed labels.
- Everything else, meaning remaining resource attributes, scope attributes, log attributes, severity, and trace and span IDs, becomes structured metadata.
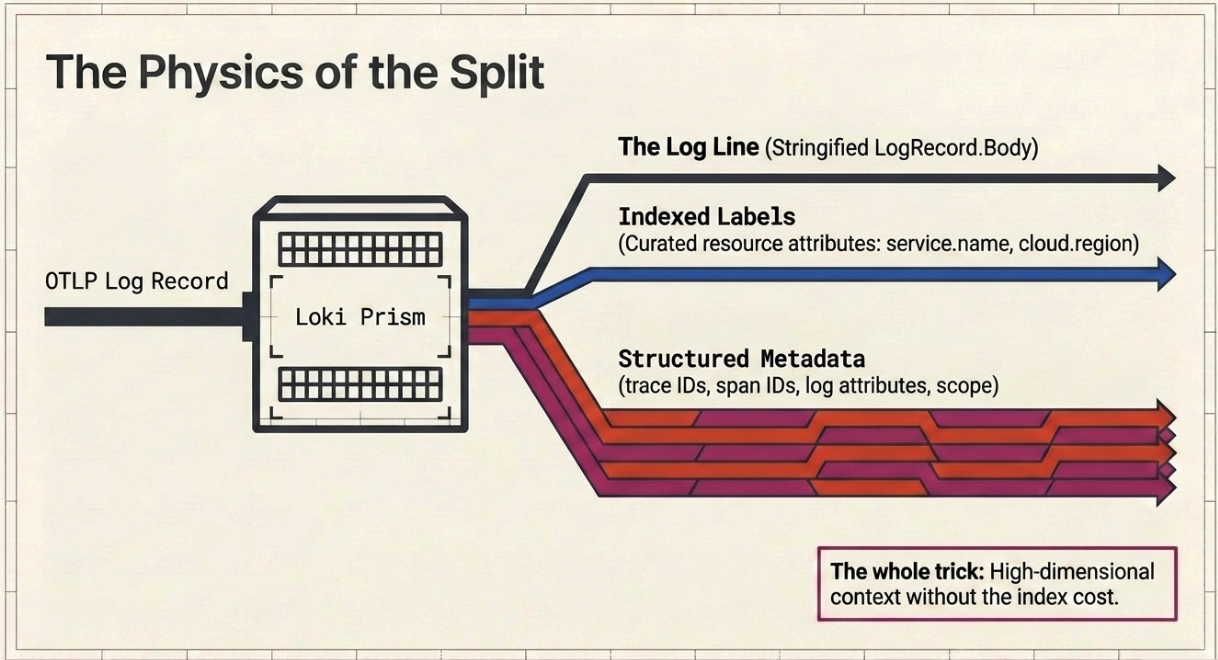
Structured metadata is the piece that matters. It is stored alongside the log line, is filterable in LogQL without a parser stage, and does not participate in stream cardinality. That is the whole trick: you get high-dimensional context without paying index costs for it. The same query as above becomes:
{service_name="auth", service_namespace="dev"} | severity_text="INFO"Same result, no parser, and a label set with a bounded number of values.
By default Loki promotes seventeen resource attributes to index labels: service.name, service.namespace, deployment.environment.name, cloud.region, cloud.availability_zone, the standard k8s.* workload names, container.name, service.instance.id, and k8s.pod.name. Attribute names are normalized on the way in, so dots become underscores and nested attributes flatten, which is why service.name is queried as service_name.
Two of those defaults deserve a hard look. Grafana's own documentation now warns against k8s.pod.name and service.instance.id as default labels because of their cardinality, and keeps them only for backward compatibility. On a cluster with autoscaling and frequent rollouts, pod names are effectively unbounded, and every deploy mints a fresh set of streams whose chunks then sit around until they flush. If you take one action after reading this post, make it auditing whether those two are still indexed in your environment.
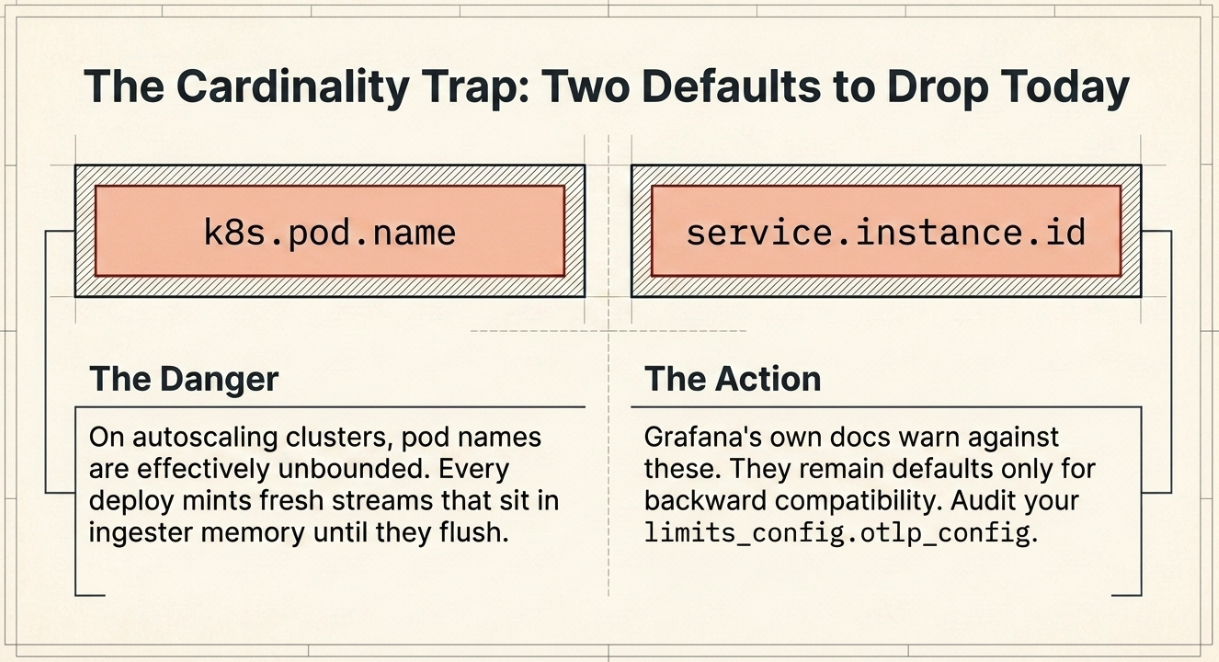
You control all of it per tenant through limits_config.otlp_config, where each attribute can be assigned one of three actions: index_label, structured_metadata, or drop. Structured metadata itself requires allow_structured_metadata: true, which is on by default in Loki 3.0 and later.
The practical upshot is that label policy became a server-side decision. Your platform team can change what gets indexed without redeploying a single instrumented application, which is the difference between a policy you can actually enforce and one that lives in a wiki.
| The old way (Loki exporter) | The new way (native OTLP) | |
|---|---|---|
| Data shape | Flattened JSON blob | Native OTel structures |
| Label policy | Hardcoded in app instrumentation | Server-side, in limits_config.otlp_config |
| Query speed | Slow, parser stage required | Fast, native filtering on structured metadata |
| Cost model | High, uncontrolled cardinality | Low, bounded index plus limitless metadata |
The migration cost is real and worth stating plainly. Moving off the Loki exporter means rewriting LogQL in dashboards, alert rules, and saved queries, because the shape of the data changes. Plan it as a migration, not a config flip.
3. Where Alloy fits, and why you still want a collector tier
If Loki speaks OTLP natively, why put anything between your applications and Loki at all?
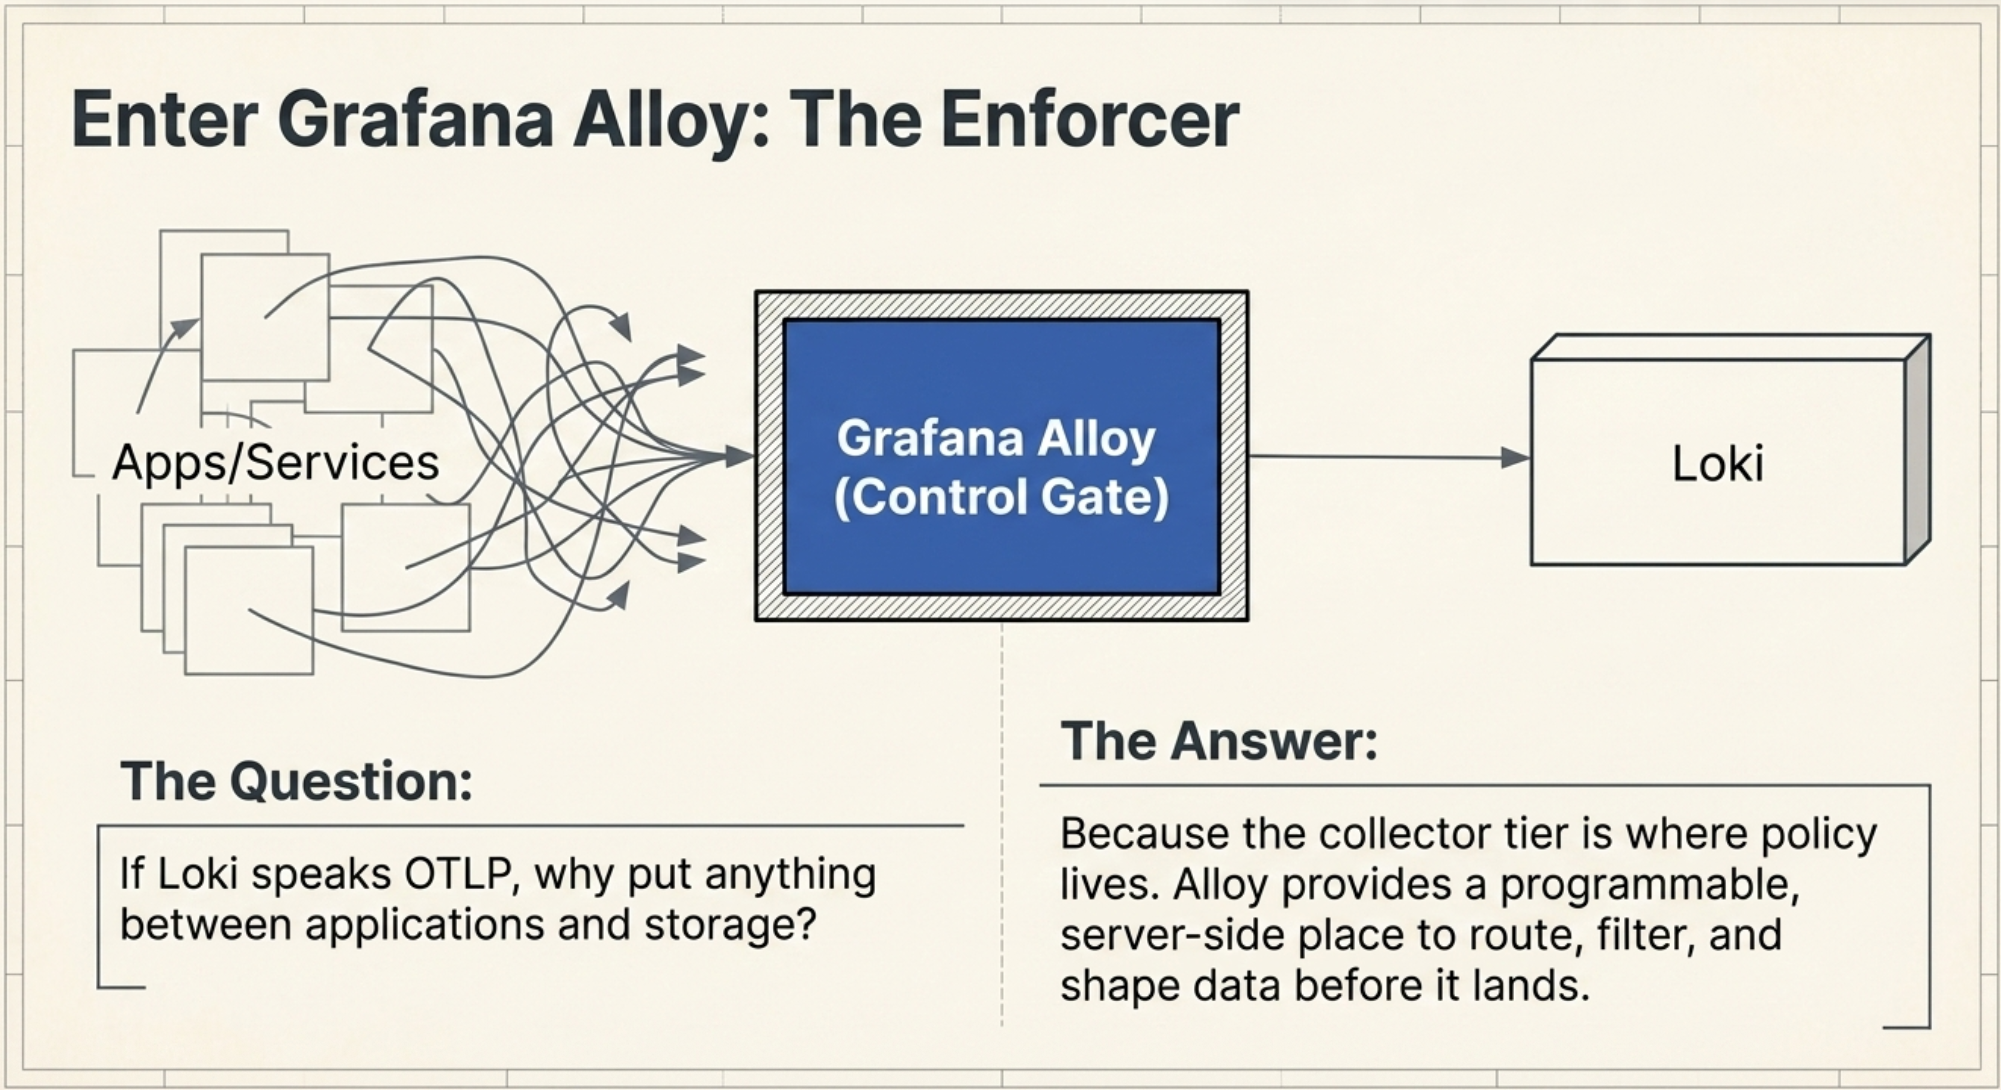
Because the collector tier is where policy lives. Grafana Alloy is Grafana's distribution of the OpenTelemetry Collector, and it runs the upstream otelcol.* components, receivers and processors and exporters, inside a programmable configuration language where components are wired together explicitly by referencing each other's inputs. A minimal logs path is three components:
otelcol.receiver.otlp "default" {
  http {}
  grpc {}

  output {
    logs = [otelcol.processor.batch.default.input]
  }
}

otelcol.processor.batch "default" {
  output {
    logs = [otelcol.exporter.otlphttp.default.input]
  }
}

otelcol.exporter.otlphttp "default" {
  client {
    endpoint = "http://loki:3100/otlp"
  }
}
That explicit wiring is the design point. You can read the data flow off the config rather than inferring it from a pipeline list, and branching, sending security events to one backend and everything else to Loki, is just another reference in an output block.
Alloy also carries Loki's own native components alongside the OTel ones, including local.file_match, loki.source.file, loki.process, and loki.write. That matters more than it sounds. Almost nobody gets to run a purely OTLP-native estate. You have a legacy Java service writing to a file, a syslog appliance, a vendor container you cannot instrument. Alloy lets those sources join the same pipeline and land in the same Loki, so you get one agent to deploy and one thing to reason about rather than an OTel Collector plus a Promtail plus whatever else accumulated.
The collector tier buys you four things that are painful to do anywhere else:
- Redaction before egress. Strip tokens and PII in flight, so the sensitive value never reaches durable storage.
- Enrichment. Attach cluster, region, and environment attributes centrally instead of asking every team to set them correctly.
- Buffering and retry. Absorb a Loki restart without dropping the logs from the incident that caused it.
- Cost control at the edge. Drop health-check and readiness-probe spam where it is cheapest to drop, before it is transmitted, ingested, and stored.
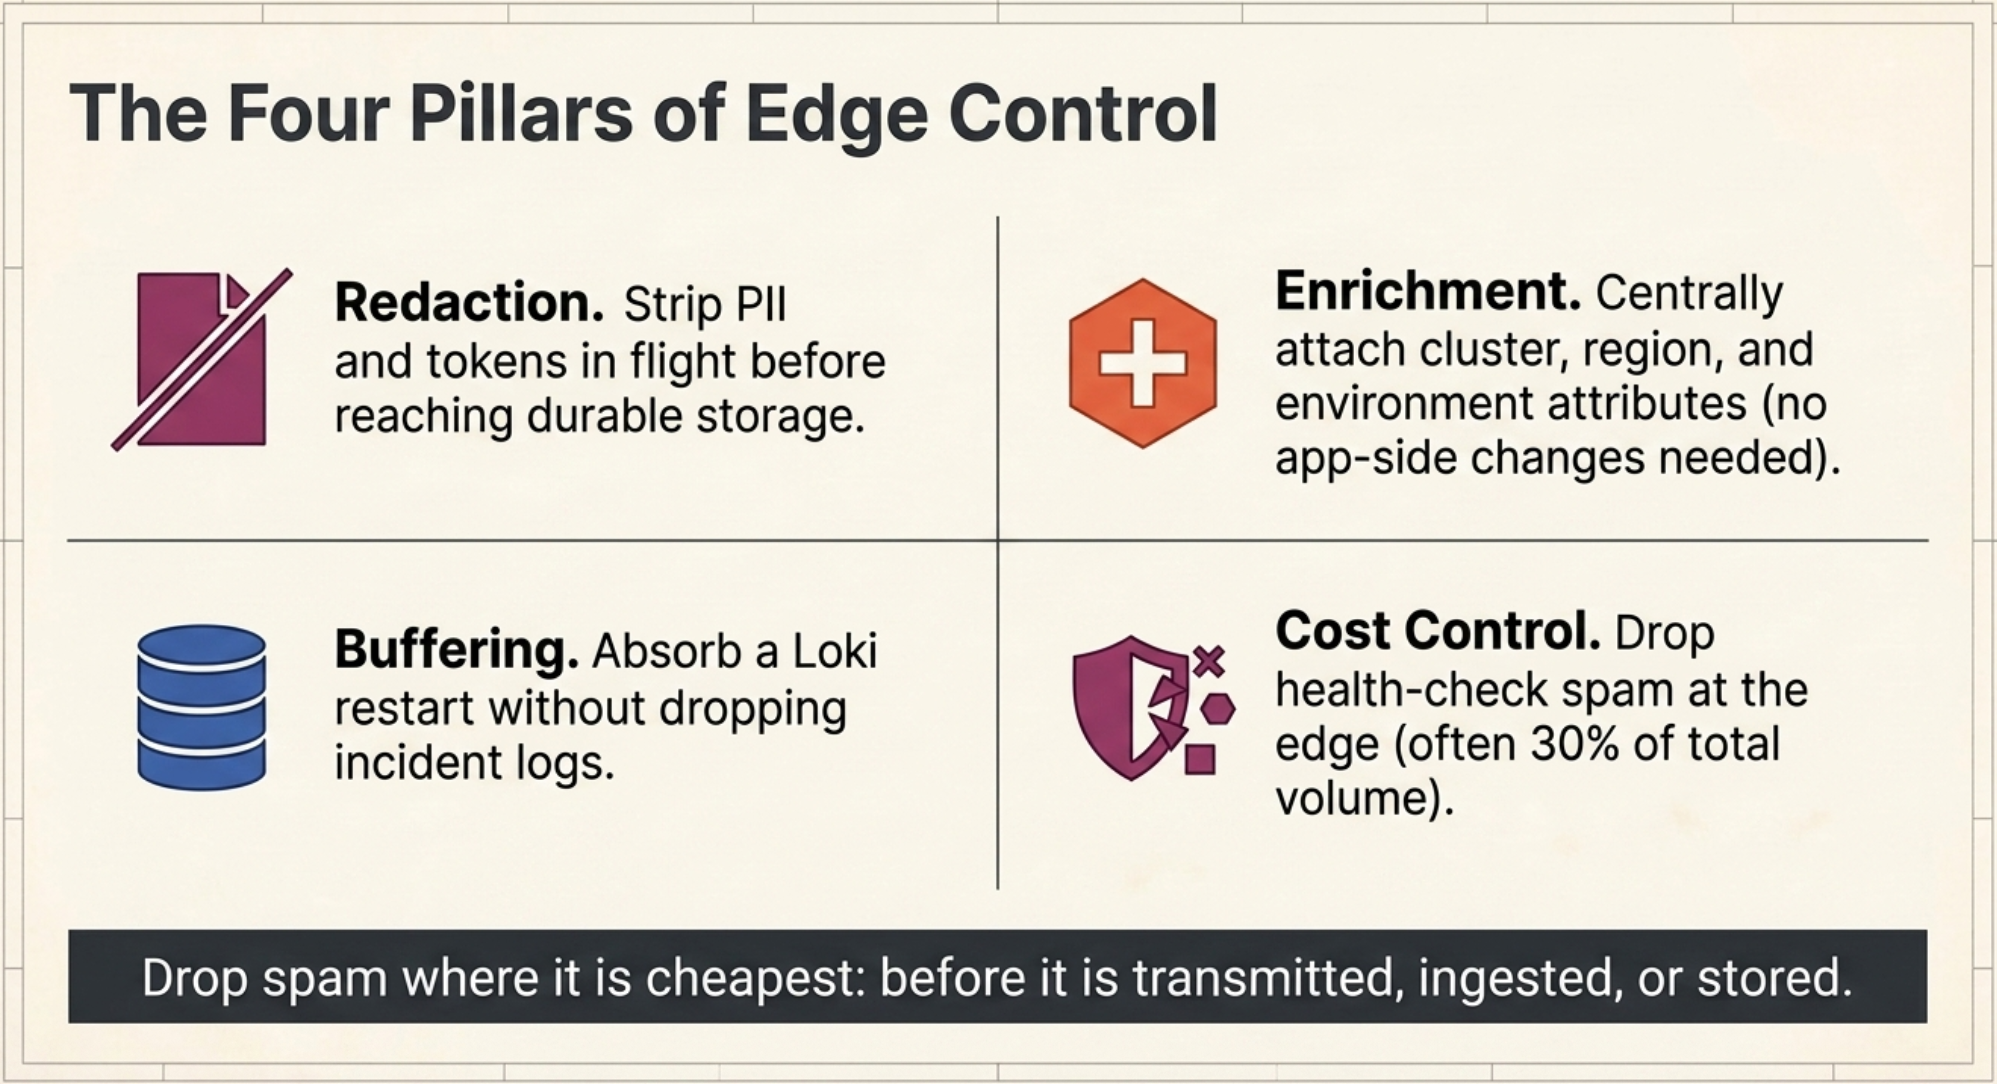
That last one is unglamorous and usually the biggest line-item win. For a team that has spent a quarter arguing about log budget, being able to point at a filter rule and say "that is 30% of our volume, and here is the one line that removes it" changes the conversation from rationing to engineering. If you want the broader version of that exercise across all three signals, our observability cost optimization checklist is the companion piece.
Alloy is where you enforce the label decision that Section 2 made possible. Loki decides what it will index. Alloy decides what shows up to be indexed.
Wrapping up
The takeaway holds up under the detail: OpenTelemetry logs, Loki, and Alloy let you stop trading context for cost. Loki's native OTLP endpoint splits your data into a small indexed label set and unbounded structured metadata, and Alloy gives you a programmable, server-side place to decide which fields go where, without touching application code.
For most of us, the win is not architectural elegance. It is that the person on call can filter by trace ID, severity, and customer tier without a parser stage and without the query timing out, and that nobody has to decide during an incident whether an investigation is worth the cardinality. Those are the same problem, and this stack finally lets you solve them together.
We covered the three things promised: why traditional pipelines break on index cardinality, what Loki's native OTLP endpoint changes about labels and structured metadata, and where Alloy fits as the policy tier. Part 2 gets hands-on, building the pipeline out from the three-component minimum, shaping and redacting data in flight with OTTL, tuning otlp_config on the Loki side, and the handful of signals worth watching once it is live.
Two things worth doing before then:
- Audit whether
k8s.pod.nameandservice.instance.idare still indexed labels in your Loki configuration. - Pull a stream-count metric for your largest tenant and find out which label is actually driving it.
If you would rather not run that audit alone, talk to us. Sorting out what belongs in the index is the kind of decision that is much cheaper to get right before the migration than after.
If Loki accepts OTLP natively, do I still need a collector like Alloy?+
Yes, in almost every real estate. Loki's native endpoint solves the format and storage problem, but it can only act on what reaches it. The collector tier is where you redact PII before it hits durable storage, attach cluster and region attributes centrally instead of trusting every team to set them, buffer through a Loki restart without losing the logs from the incident that caused it, and drop health-check spam at the point where dropping is cheapest. Alloy also runs Loki's native file and syslog components alongside the OpenTelemetry ones, so legacy sources you cannot instrument join the same pipeline instead of needing a second agent.
What is structured metadata, and why doesn't it cost me anything in cardinality?+
Structured metadata is a set of key-value pairs stored alongside the log line rather than in the index. Stream cardinality is driven only by unique combinations of index label values, so adding a hundred structured metadata fields creates no new streams. You can still filter on them in LogQL directly, with no parser stage, because Loki stores them in a form it can read without re-parsing the body. That is what lets you keep trace IDs, request IDs, and customer tier queryable without the index cost that put you in trouble in the first place.
Should I remove k8s.pod.name and service.instance.id from my index labels?+
Audit them first, and expect the answer to be yes for most clusters. Grafana's documentation no longer recommends either as a default label because of cardinality, and both remain defaults purely for backward compatibility. On a cluster with autoscaling and frequent rollouts, pod names are effectively unbounded, so every deploy mints a fresh set of streams whose chunks sit in ingester memory until they flush. If your team genuinely needs pod-level filtering, the better move is usually reassigning the attribute to structured_metadata in otlp_config rather than dropping it, so you keep the ability to filter without paying index cost for it.
What actually breaks when I migrate off the deprecated Loki exporter?+
Your queries. The exporter encoded the whole record into a JSON or logfmt blob, so existing LogQL relies on a parser stage and on label names that came from hint attributes. Native OTLP produces a different data shape: normalized label names with dots converted to underscores, and everything outside the curated resource-attribute set living in structured metadata. Dashboards, alert rules, and saved queries all need rewriting against the new shape. The ingestion change itself is small; the query surface is where the work is, which is why it should be planned as a migration rather than a configuration flip.
How many labels is too many in Loki?+
There is no fixed number, because what matters is the product of each label's distinct values rather than the count of labels. Two labels with ten values each produce one hundred streams. Adding one more label with five hundred values produces fifty thousand. The practical rule is to index only attributes with bounded, predictable value sets, such as service name, namespace, environment, and region, and to route everything with unbounded or unpredictable values to structured metadata. Before you change anything, pull a stream-count metric for your largest tenant and find out which label is actually driving the number.
Can I change what Loki indexes without redeploying my applications?+
Yes, and this is the most underrated part of the native OTLP change. Label policy lives server-side in limits_config.otlp_config, per tenant, where each attribute can be assigned index_label, structured_metadata, or drop. Your platform team can retune the index without touching instrumented application code or waiting on a deploy cycle from every service owner. That is the difference between a label policy you can enforce and one that lives in a wiki page nobody reads.