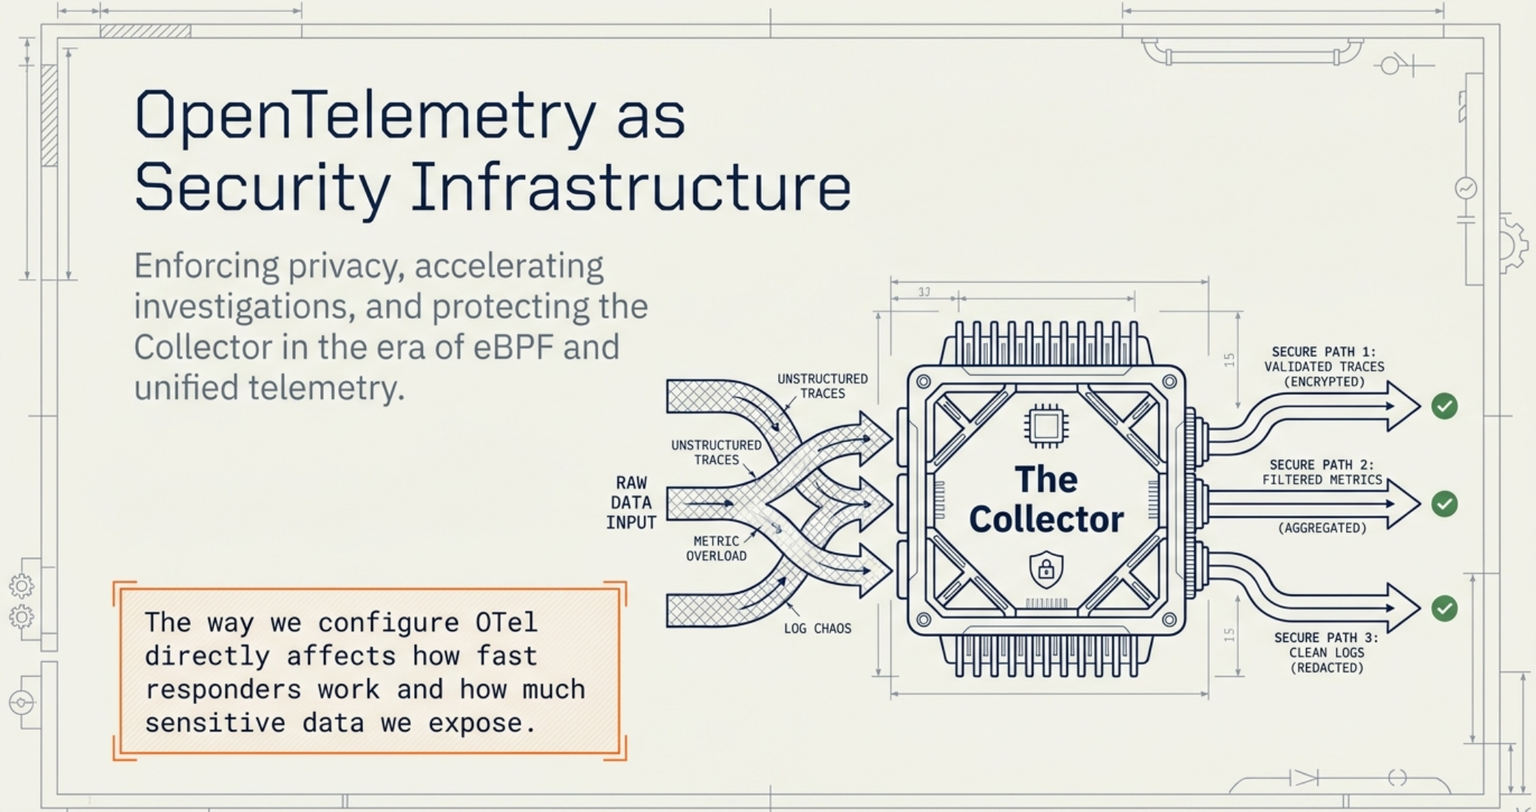
If you have worked a security incident, you know the hard part is rarely a shortage of data. It is finding the right records quickly, trusting what they say, and discovering—too late—that the monitoring system quietly stored a password or a customer's card number along the way. Many of us now send most of our monitoring data through OpenTelemetry, which means the way we configure it directly affects how fast our responders work and how much sensitive data we expose.
The bottom line: the OpenTelemetry Collector can now enforce real rules about which monitoring data is kept, cleaned, sent where, and signed. OpenTelemetry eBPF Instrumentation (OBI) can now connect application logs to the requests that produced them without any code changes. Neither one decides whether an action inside your application should have been allowed. Used within that limit, together they shorten investigations and reduce accidental exposure of sensitive data—but the Collector then becomes a security system in its own right and must be protected like one.
We will cover this in five parts:
- What the Collector can enforce today
- The shared policy format that is coming, and why it is not ready for privacy rules
- What OBI adds to an investigation
- The limits: trace IDs are not identity, and OBI has real deployment costs and is not yet at 1.0
- How to protect the Collector itself
Part 1: What the Collector can enforce today
A Collector sits between many applications and the places their data ends up. That position is what makes it useful: instead of asking every application team to write the same data-handling rules, an organization can apply one set of rules in a small number of managed Collectors.
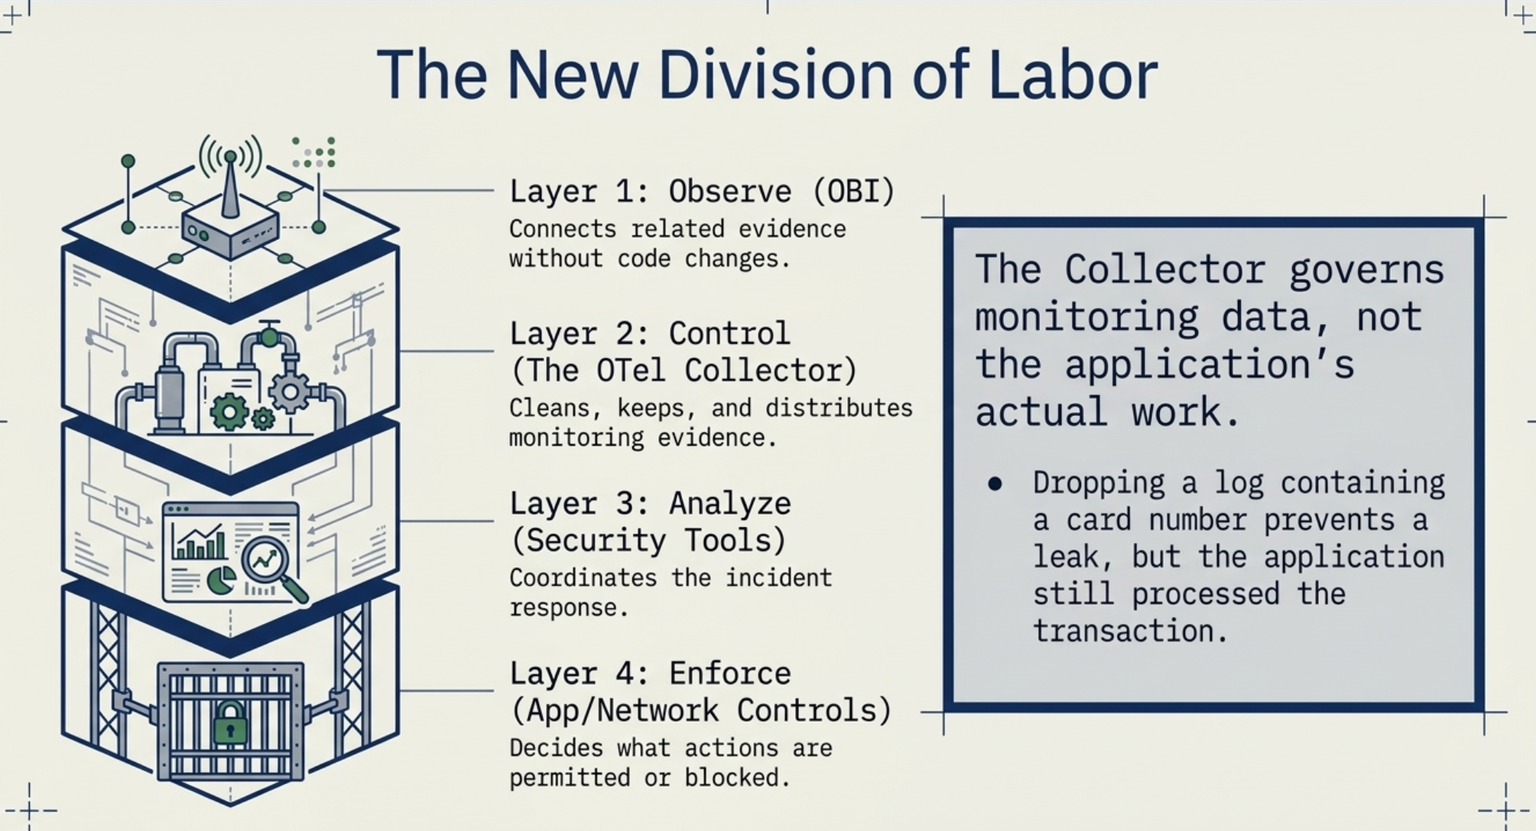
The scope of those rules matters, though. They govern the monitoring data, not the application's actual work. If the Collector drops a log containing a card number, the number never reaches the monitoring system—but the application still processed it. If the Collector sends a failed login to the security team, investigation gets easier—but the login attempt was not blocked.
Quick reference
| Component | What it does | Maturity (as of October 2026) |
|---|---|---|
| Filter processor | Drops records that match conditions you write | Alpha for traces, metrics, and logs; development for profiles |
| Redaction processor | Keeps only approved fields, masks blocked values, cleans database queries | Beta for traces; alpha for logs and metrics |
| Attributes processor | Inserts, updates, deletes, or hashes fields | Beta |
| Transform processor | General-purpose rewriting of records | Beta for traces, metrics, and logs; development for profiles |
| Routing connector | Sends records to different pipelines based on their content | Alpha for traces, metrics, and logs |
| Signing processor | Adds a cryptographic signature to log records | Development, logs only; not in any official Collector build |
| Telemetry Policy Processor | Applies policies from a shared policy file (see Part 2) | Development; not in any official Collector build |
Filtering
The filter processor drops spans, span events, metrics, individual data points, and logs that match conditions you define. If any condition matches, the record is dropped. Teams use it to discard health-check noise, records from services that are not approved, or data that should not leave a given environment.
Every record you drop is one less record that can leak. It is also one less record a responder can find later. The processor's own documentation warns that dropping a parent span can leave its child spans and related logs "orphaned"—present, but disconnected from the request they belonged to.
Treat filter rules like production code: review them, test them against realistic data, watch what they drop, and change them through a controlled process. Filter processor documentation
Redaction and rewriting
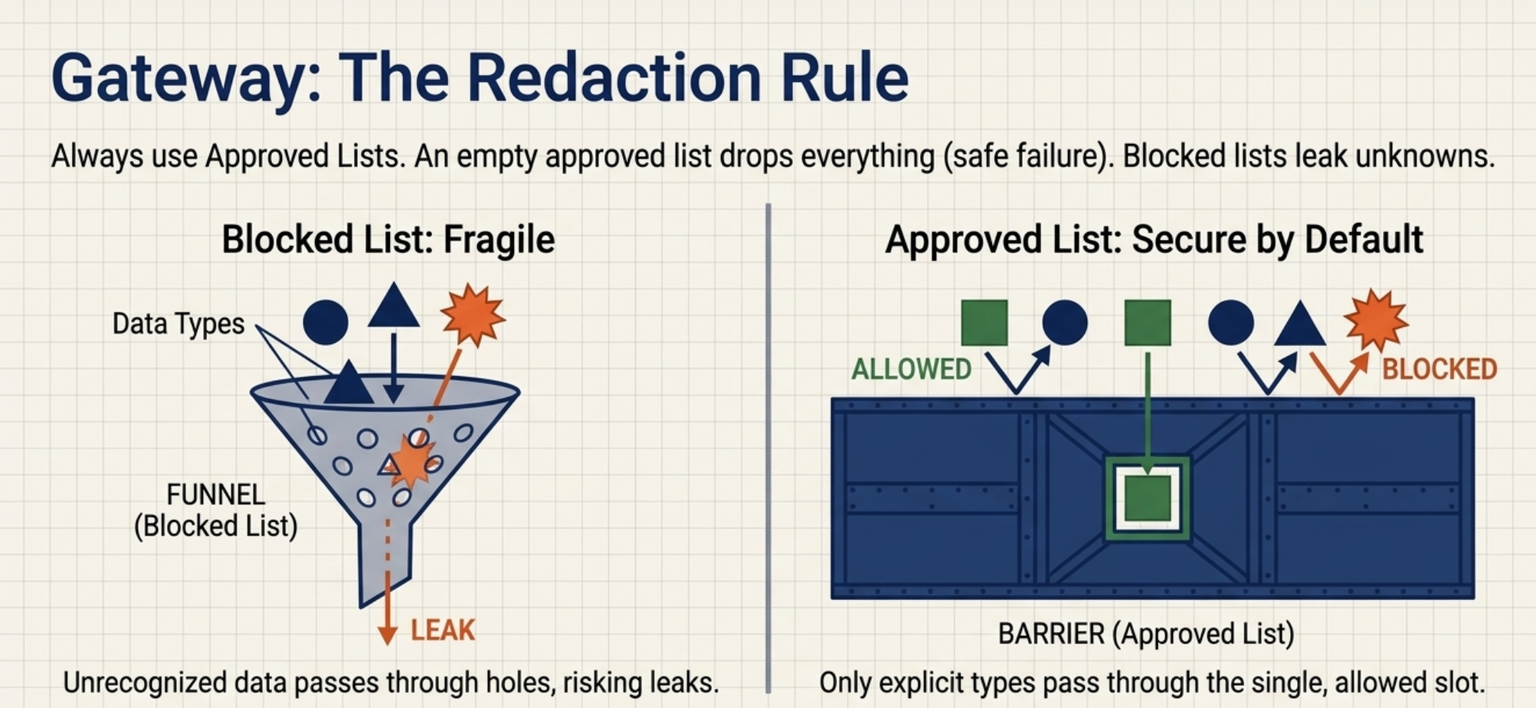
The redaction processor works from an approved list of field names. Any field (attribute) not on that list, or on a separate ignore list, is deleted. If the approved list is empty, every field is removed—a safe failure. It can also mask values that match patterns you define, such as card-number formats.
Its database cleaner removes literal values from queries and commands for SQL databases, Redis, Memcached, MongoDB, OpenSearch, and Elasticsearch. By default it also cleans the names of the affected client spans, which is worth knowing if your dashboards group by span name.
An approved list is safer than a blocked list. New fields appear over time, and a blocked list only catches what someone thought of in advance. Even so, the processor's documentation calls itself one line of defense rather than the only compliance measure you should have. Redaction processor documentation
The attributes and transform processors handle more general changes:
- Delete or replace fields in either processor.
- Hash a value to hide it while keeping it matchable. The attributes processor's built-in hash uses an older method (SHA-1). The transform processor offers newer ones, such as SHA-256, through its OTTL functions. Note that hashing an easily guessed value, such as an email address, can be reversed by someone who hashes likely guesses and compares.
- Rename a field. The attributes processor has no rename action; you copy the value to the new name and delete the old one. The transform processor can do the same, or rename keys with a single pattern-replace statement.
OpenTelemetry's own documentation describes the Collector as a convenient place to transform data, often to meet data-handling and security rules. Transforming telemetry
The risk is that a rewrite can change what a record means, not just how it looks. Changing a status, service name, customer identifier, or timestamp incorrectly can send an investigation in the wrong direction. Change security-relevant fields only when you fully understand the effect.
Routing
The routing connector sends records to different pipelines based on conditions. Those conditions can test fields inside the record or metadata attached to the incoming connection (HTTP headers, or the equivalent on gRPC—a common service-to-service protocol—read through otelcol.client.metadata and otelcol.grpc.metadata; the older request context is deprecated).
Common uses:
- Send records to a destination in the right region to meet data-residency rules.
- Keep each customer's data in its own pipeline.
- Copy serious errors to the security team while keeping them in the normal log store.
- Send all audit records to a protected archive.
- Keep low-value operational logs in cheaper storage.
Two cautions apply.
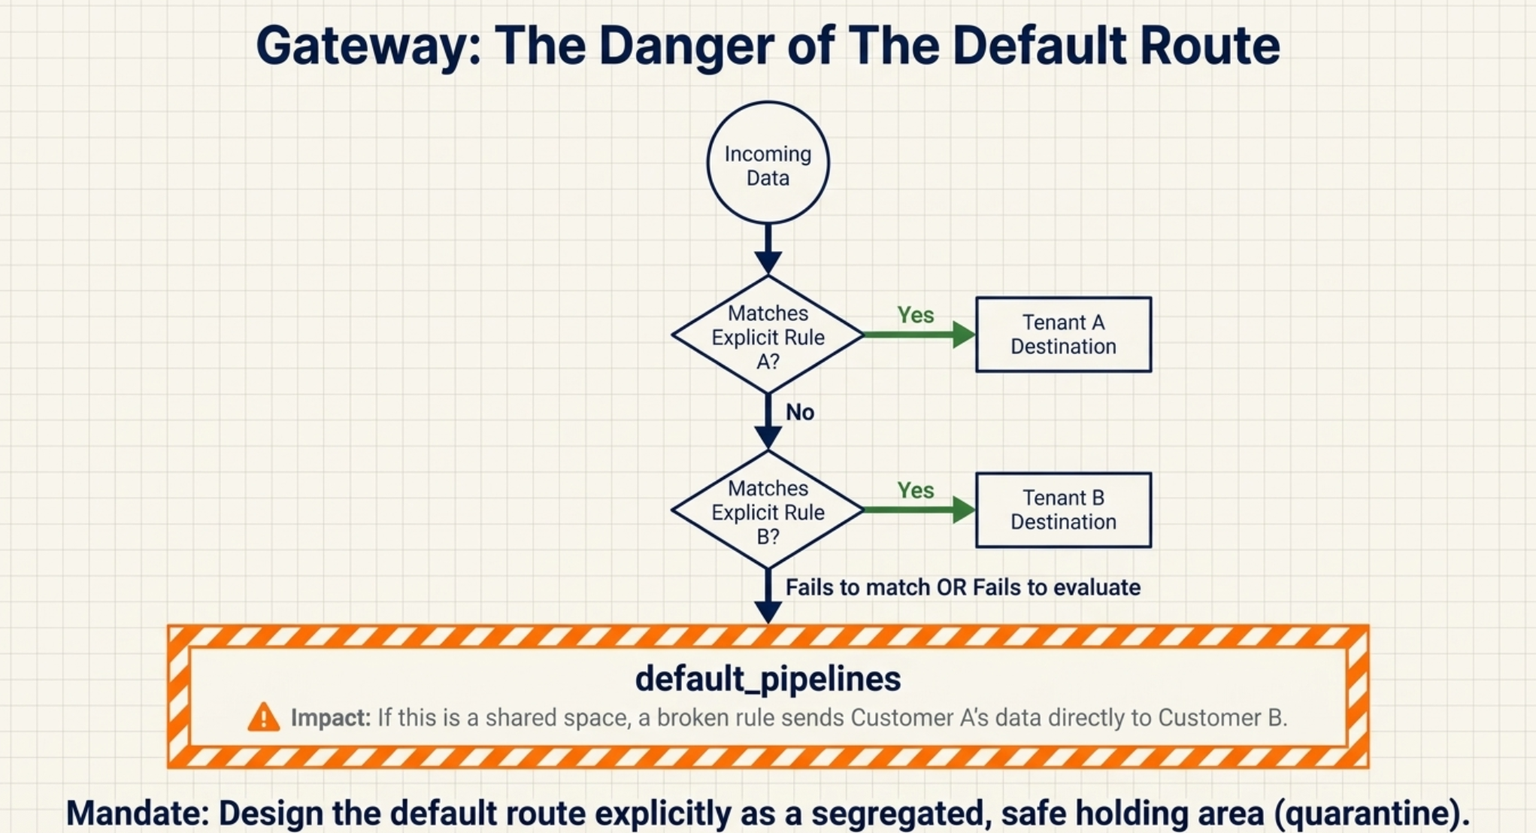
Headers are claims, not facts. A tenant, region, or environment header sent by a client is only what that client says. Authenticate the sender, and base security-sensitive routing on trusted connection details or on information the Collector adds itself.
The default route matters more than it looks. Records that match no condition go to the pipelines listed in default_pipelines. With the default error setting, records whose condition fails to evaluate also go there. If the default is a shared destination, a broken rule can send one customer's data to another customer's pipeline. Make the default a safe holding area. Routing connector documentation
Signing audit records
The signing processor turns each log record into a standard, consistent text form, computes a signature, and stores it on the record. It supports four standard public-key signature types (RS256 by default, plus RS512, ES256, and EdDSA) and HMAC-SHA256—a shared-secret check rather than a true signature, since anyone who can verify it can also create it. Keys can come from a file, an environment variable, a Kubernetes-stored secret, or OpenBao, an open-source secrets vault.
A signature shows that a record has not changed since it was signed. It cannot show that the original event was true, and it cannot detect changes made before the record reached the Collector.
The processor is at development maturity, handles logs only, and is not included in any of the ready-made Collector packages the project publishes—you would need to build your own Collector to use it. It was designed around a proposed audit-logging data type that is not yet part of the OpenTelemetry specification. Treat it as an experiment worth testing, not a control to rely on. Signing processor documentation
Why this part matters: each of these components lets you enforce a data-handling rule once, centrally, instead of in every application. Each also carries a risk of removing or distorting the evidence responders need, which is why they deserve the same care as any other production change.
Part 2: A shared policy format is coming—but not for privacy rules yet
Today, Collector rules live inside each Collector's configuration file. That makes them hard to share, review, and apply the same way across many Collectors.
OpenTelemetry is working on a portable policy format, described in the Telemetry Policies proposal. Its examples include dropping debug logs, redacting card numbers, and keeping 5% of database spans. A matching Telemetry Policy Processor now exists in the Collector's contributed components at development maturity. It is marked as work in progress and is not in any official build.
There is one design choice security teams need to know about. The proposal requires policies to fail open: a policy that cannot be read is skipped, and if a policy fails while processing a record, that record passes through untouched by that policy. That is the right choice for avoiding lost data. It is the wrong choice for a rule whose only job is to stop sensitive data from leaving—a broken redaction policy would let the data through untouched. (Trace sampling has an optional setting to fail closed instead; the other policy types do not.)
Why this part matters: the policy format will likely make rules easier to manage in the future. For now, keep privacy and data-protection rules in components that fail safely, such as the redaction processor's approved list.
Part 3: What OBI adds to an investigation
The Collector controls how monitoring data is handled. OBI solves a different problem: getting useful data from applications that were never built to produce it.
OBI uses eBPF to observe supported application and network activity from the Linux kernel. It produces trace spans and request-rate, error, and duration metrics with no code changes and no libraries to install. OBI documentation
On October 6, 2026, the project announced that OBI can now add trace and span IDs to an application's existing logs. It works with JSON, newline-delimited JSON, and plain-text lines written to standard output or standard error. Plain-text lines receive a key=value annotation. The feature is off by default and needs no logging-library changes, rebuilds, or redeployments. Trace–log correlation announcement
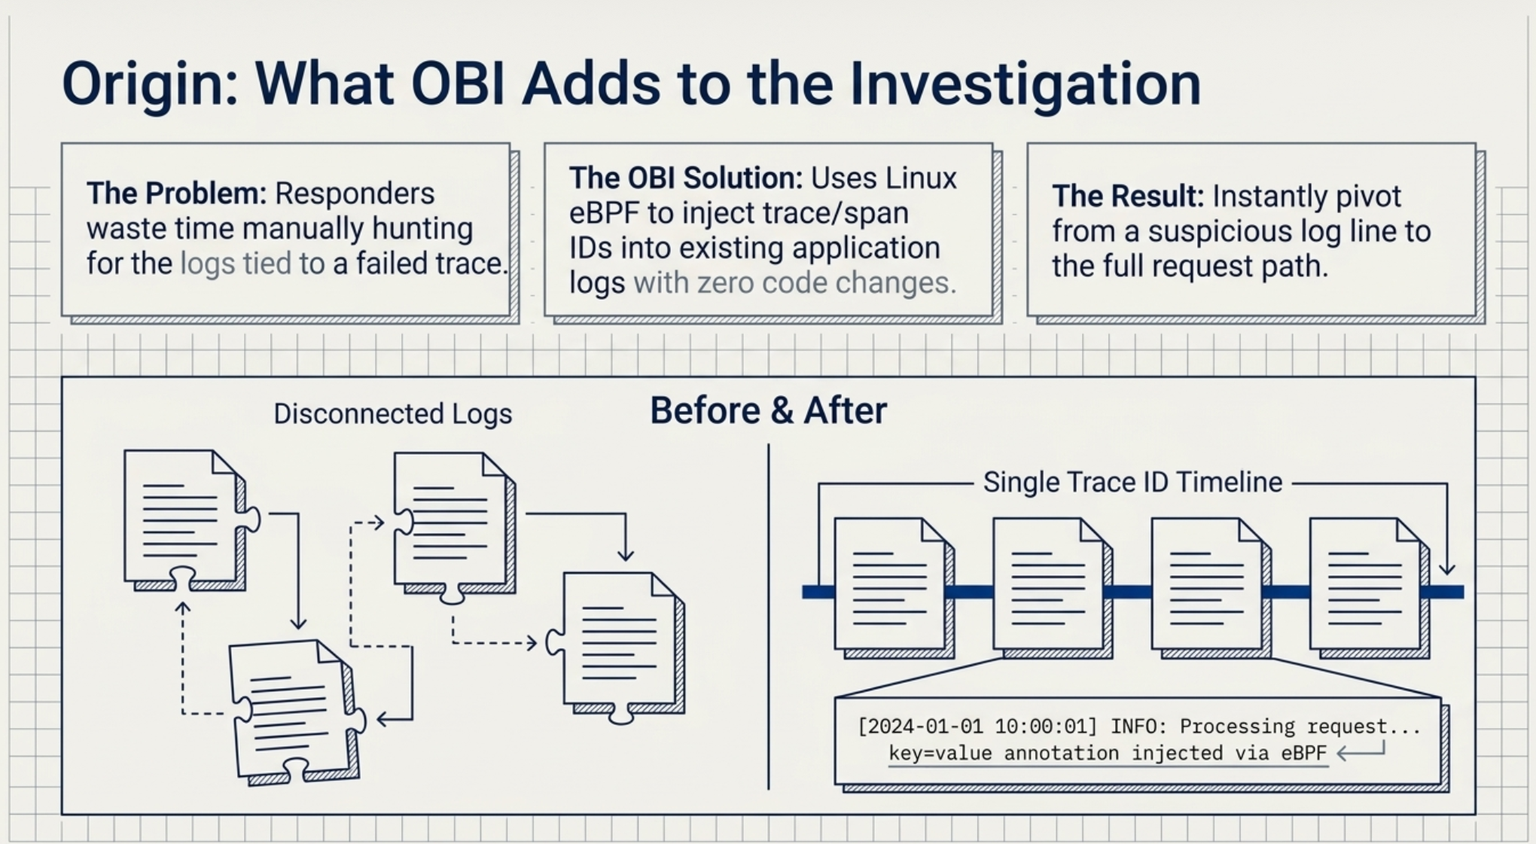
Think about what that does for the person on call. A responder who starts with a suspicious log line can use its trace ID to see the full path of the request. A responder who starts with a failed trace can pull the exact log lines it produced. Together they show which service handled the request, which systems it called, where the error first appeared, and what else happened during the same request.
OBI can also record selected HTTP headers and request and response bodies. This is off by default. When turned on, it applies an ordered list of include, exclude, and obscure rules, which can match on header names, URL paths, and HTTP methods, and can obscure specific fields inside JSON bodies. OBI header and body enrichment
The word selected matters. Authorization headers, cookies, query strings, request bodies, and user IDs often carry credentials or personal information. Start with a short include list, and obscure sensitive values in OBI itself, as close to the source as possible.
Why this part matters: OBI fills the gap that slows most investigations—connecting a log line to the request behind it—for applications you cannot or will not change.
Part 4: The limits
Trace IDs are not identity
A trace ID is a good way to line up related records. It is not proof of who made a request.
Trace IDs travel in request headers across networks and between organizations. Unless a trusted system replaces or checks them at your boundary, an outside caller can supply any trace ID it likes. A security system should never treat one as evidence of who acted.
The same applies to fields taken from headers. A field named user.id or tenant.id is only as reliable as the system that set it and protected it.
Use trace data to build a timeline. Use authentication records, the verified identity of the service or machine involved, network controls, and access logs to establish who or what was allowed to act.
OBI has real deployment costs
Not changing application code does not mean no operational risk.
Permissions. OBI 0.14.0, released October 2, 2026, can attach most of its probes without the broad Linux CAP_SYS_ADMIN permission. Features that write into an application's memory still need it, including library-level Go context propagation. OBI 0.14.0 release notes
Log enrichment is one of those features: it blanks each original log write and emits an annotated copy in its place. That requires CAP_SYS_ADMIN and a kernel that is not running in lockdown mode—a Linux setting that stops even administrators from modifying the running kernel. Most distributions do not turn lockdown on by default; if yours does, weigh that trade-off before changing it. Trace–log correlation announcement
Kernel version. Enriching ordinary log writes needs Linux 6.0 or later. On older kernels, only writes made with writev() are enriched, so coverage depends on how your runtime's logger writes, and OBI's documentation lists 6.0 as a requirement. OBI trace–log correlation documentation
Coverage limits.
- Only standard output and standard error are covered—not log files or loggers that send directly over the network.
- A line must be written while OBI is tracking an active request. Startup and background-job logs pass through unchanged.
- Each log line must be written immediately, by the thread handling the request (synchronous logging). Python needs
PYTHONUNBUFFERED=1, .NET needs a synchronous console writer, and Node.js writing to a pipe can miss lines or attach the wrong request under load. - Writes larger than 8 KiB (8,192 bytes) are split. Only the first part is enriched.
- OBI leaves blank placeholder lines (filled with null characters) where it replaced the original. Your log pipeline must drop them.
- Logs from Java's newer lightweight "virtual" threads are not enriched yet. Ordinary Java threads are.
- Applications that already create their own OpenTelemetry traces get only the trace ID, because OBI's span IDs would not match the ones the application created.
None of these limits rules the feature out. They do mean a careful rollout: start with one low-risk service, check the resulting logs, measure the overhead, and confirm the IDs consistently lead to the right traces.
Release status. OBI published its first 1.0 release candidate, v1.0.0-rc.1, on October 6, 2026 (US time; October 7 UTC). OBI's original (v1) configuration format remains supported but frozen—no bug fixes or new features—and new work uses the v2 format. The final 1.0 release requires at least 14 days of maintainer testing and sign-off from at least two maintainers. OBI v1.0.0-rc.1 release notes
Why this part matters: both tools are useful only if your team trusts their output for the right things. Knowing where each one stops is what keeps an investigation honest.
Part 5: Protect the Collector itself
Once a Collector decides what data may leave an environment, it is security infrastructure. A compromised Collector could leak secrets, hide evidence, alter records, send data to the wrong place, or stop monitoring altogether. Its configuration and credentials deserve matching protection.
A practical order of operations:
- Authenticate everything that sends data to the Collector, and encrypt traffic in both directions.
- Establish the verified identity of each sending service and customer instead of accepting routing headers at face value.
- Drop records that are not permitted or not needed.
- Keep only an approved list of fields.
- Mask, hash, or remove sensitive values.
- Route records based on trusted identity, destination, and residency rules—with a safe default route.
- Sign audit records only after all intended changes are made.
- Monitor dropped records, rule failures, data volume, memory use, and configuration changes.
Run the Collector with the fewest permissions possible, have it listen only where it must, and include only the components you actually use. OpenTelemetry publishes Collector guidance on configuration and hosting, and separate guidance for OBI's permissions.
Why this part matters: every rule in Parts 1 through 3 is only as trustworthy as the Collector that runs it.
Conclusion
In short: the Collector is now a workable place to decide what monitoring data may leave, where it goes, and what evidence is preserved, and OBI makes that evidence easier to gather and connect. The clearest way to use them is a simple division of work:
- OBI observes activity and connects related evidence.
- The Collector decides how that evidence is cleaned, kept, and distributed.
- Security tools analyze it and coordinate the response.
- Application, identity, network, and host or container security controls decide what is allowed and what is blocked.
For the people doing this work, that division means faster answers during an incident and fewer late-night discoveries that a password ended up in a log index. The cost is that the people who run the monitoring pipeline now share responsibility for security, and should be brought into design and review the same way.
We covered five parts: what the Collector enforces today, the coming policy format and its fail-open design, what OBI adds, the limits of trace IDs and OBI, and how to protect the Collector. Practical next steps:
- List your Collectors and their rules. Note which components are alpha or development and which rules handle sensitive data.
- Switch redaction to approved lists wherever you still rely on blocked lists.
- Check every routing default. Confirm that unmatched or failed records go somewhere safe.
- Pilot OBI log correlation on one service that runs on Linux 6.0 or later, logs synchronously to standard output, and can accept the required permissions. With the v2 configuration format, log annotation is available only when OBI runs as a standalone process.
- Wait on the policy processor and signing processor for anything privacy-critical until they mature, but test them now so you are ready.
Can the OpenTelemetry Collector block a malicious request?+
No. The Collector's rules govern monitoring data, not the application's actual work. It can drop, redact, route, or sign telemetry about a request, but it does not decide whether the request should have been allowed. That job belongs to application, identity, network, and host or container security controls.
Should I use an approved list or a blocked list to redact telemetry?+
An approved list. The redaction processor deletes every field that is not on its approved list (or a separate ignore list), and an empty approved list removes every field. A blocked list only catches fields someone thought of in advance, so new fields slip through. The processor's documentation still describes it as one line of defense, not the only compliance measure you should have.
Is the Telemetry Policy Processor ready for privacy rules?+
Not yet. It is at development maturity, marked as work in progress, and not in any official Collector build. The proposal it implements also requires policies to fail open: a policy that cannot be read is skipped, and a record that a policy fails on passes through untouched by that policy. Only trace sampling has an optional fail-closed setting.
What does OBI trace–log correlation need to work?+
It is off by default. When enabled, it adds trace and span IDs to JSON, newline-delimited JSON, and plain-text lines written to standard output or standard error while OBI is tracking an active request. It needs CAP_SYS_ADMIN, a kernel not in lockdown mode, Linux 6.0 or later for ordinary log writes, and synchronous logging. With the v2 configuration format, it is available only when OBI runs as a standalone process.
Can a trace ID be used to identify who made a request?+
No. Trace IDs travel in request headers across networks and between organizations, and unless a trusted system replaces or checks them at your boundary, an outside caller can supply any trace ID it likes. Use trace data to build a timeline, and use authentication records, verified service identity, network controls, and access logs to establish who acted.