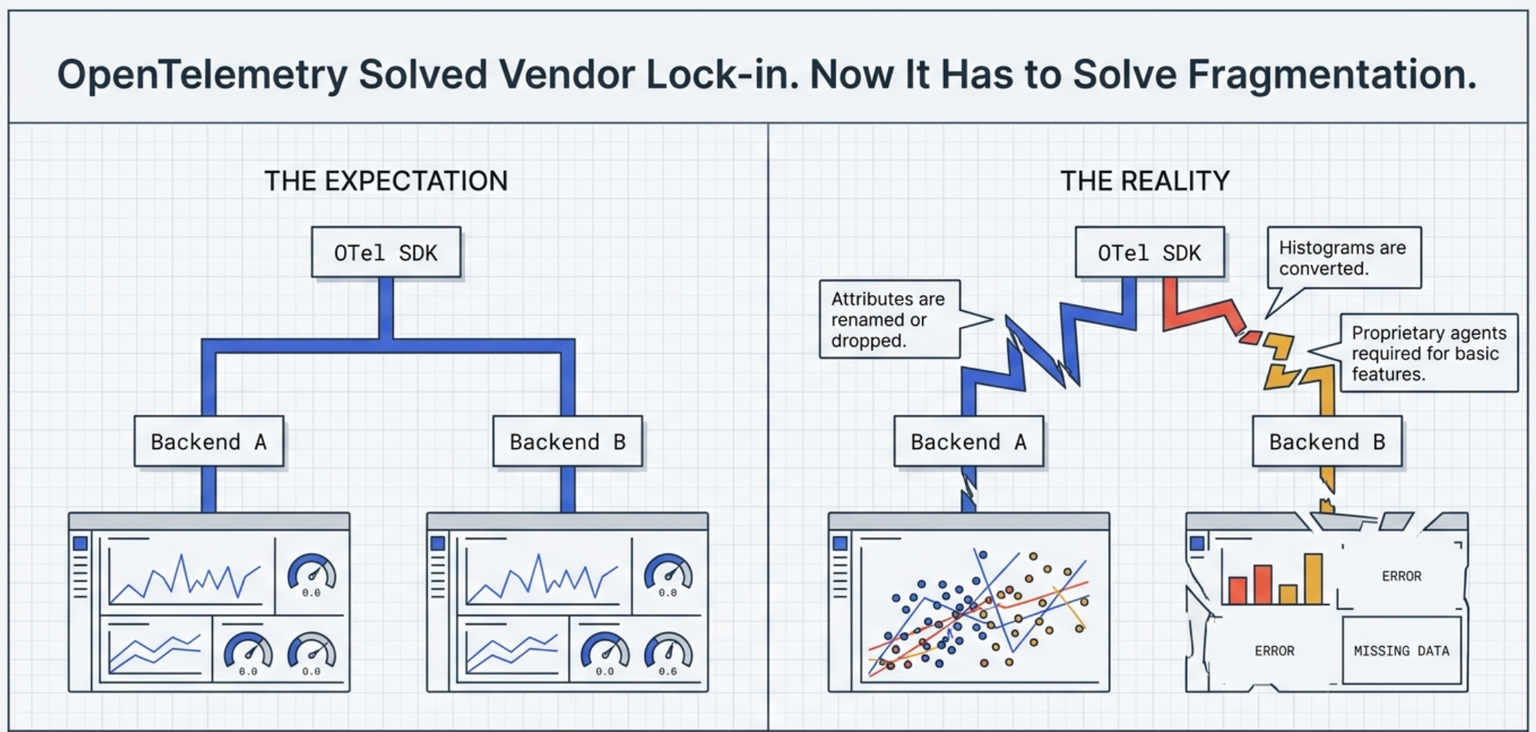
Many of us have sent the same OpenTelemetry data to two different backends and found that it doesn't look the same on the other side. Attributes are renamed, histograms are converted, and features we rely on in one product need a vendor agent in the other.
Bottom line: almost every major platform now accepts OpenTelemetry data, but few handle it the same way once it arrives. Closing that gap requires each vendor and maintainer to publish repeatable, version-specific test results that show exactly what happens to the data.
To measure the gap, I compared ten observability offerings across twelve areas: OTLP signal coverage, SDK and zero-code instrumentation, semantic conventions, context propagation, Collector compatibility, sampling, resource handling, Kubernetes and cloud support, Prometheus interoperability, GenAI conventions, upstream participation, and portability.
This article has four parts:
- What "supports OpenTelemetry" does and does not tell you
- Why the specification and its implementations drift apart
- How the ten offerings compare
- What useful compatibility evidence would contain
1. What "supports OpenTelemetry" does and does not tell you
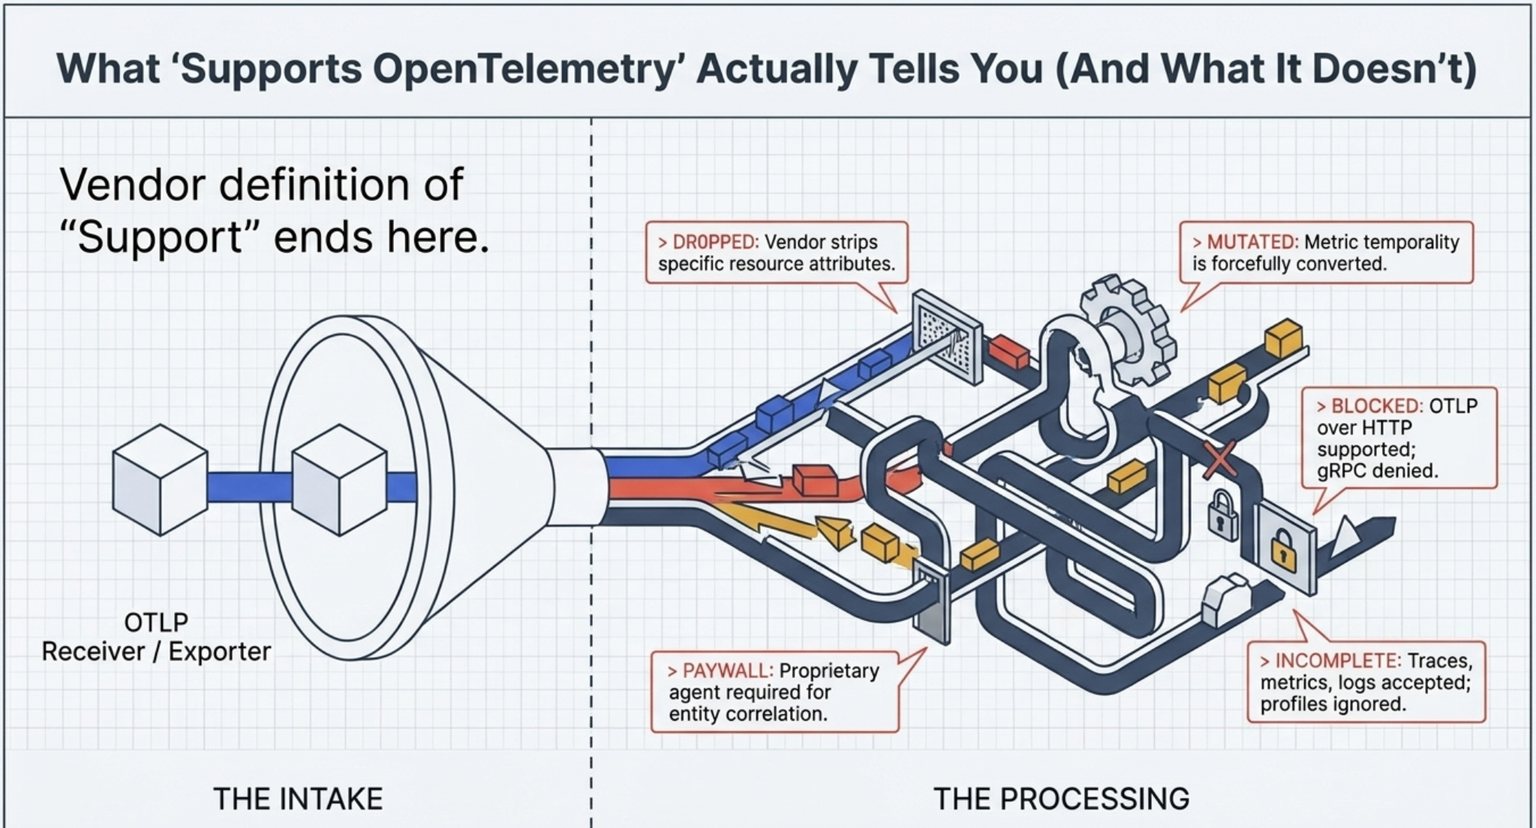
OpenTelemetry's vendor guidance says a vendor supports OpenTelemetry when it can accept output from the default SDK through an exporter, Collector component, or OTLP receiver. That definition covers intake. It says nothing about what happens to the data afterward.
A platform can accept an OTLP payload and still:
- Rename or drop attributes
- Convert metric temporality or histogram types
- Require vendor-specific headers
- Support OTLP over HTTP but not gRPC
- Treat resource attributes differently
- Require proprietary agents for full entity correlation
- Support traces, metrics, and logs but not profiles
- Recognize only certain semantic-convention versions
- Build key product features on a vendor-specific schema
All ten offerings I reviewed accept OpenTelemetry data in a credible way. None implements every part of the ecosystem without exceptions. Accepting the data is now common; handling it the same way is not.
2. Why the specification and its implementations drift apart
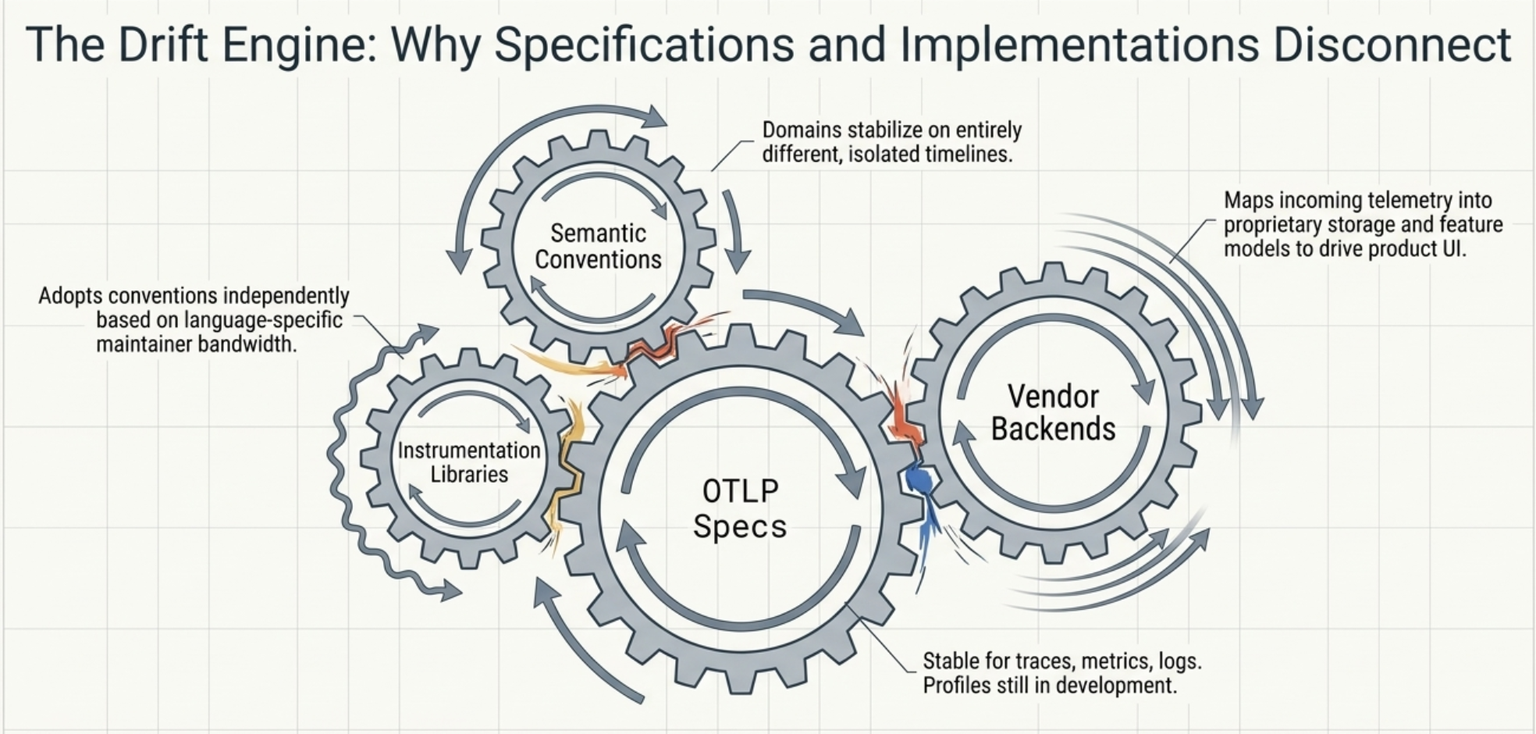
The OpenTelemetry project described this problem in its recent investigation of the instrumentation ecosystem. Semantic conventions define a shared contract, but publishing the contract does not update every instrumentation library or backend.
The project's comparison of HTTP client instrumentation found the required attributes in nearly every tested instrumentation, while recommended attributes were less consistently observed. An attribute missing from a test also does not prove an implementation can never emit it; configuration, library versions, runtime behavior, and test coverage all affect the result. Compliance can't be reduced to a checkbox.
The pieces also move on different schedules:
- The OTLP specification is stable for traces, metrics, and logs. Profiles are still in development.
- Semantic-convention domains stabilize at different times.
- Instrumentation libraries adopt those conventions on their own timelines.
- Backends then map the resulting telemetry into their own storage and product models.
Each choice is reasonable on its own. Together, they produce the inconsistencies described in Part 1.
3. How the ten offerings compare
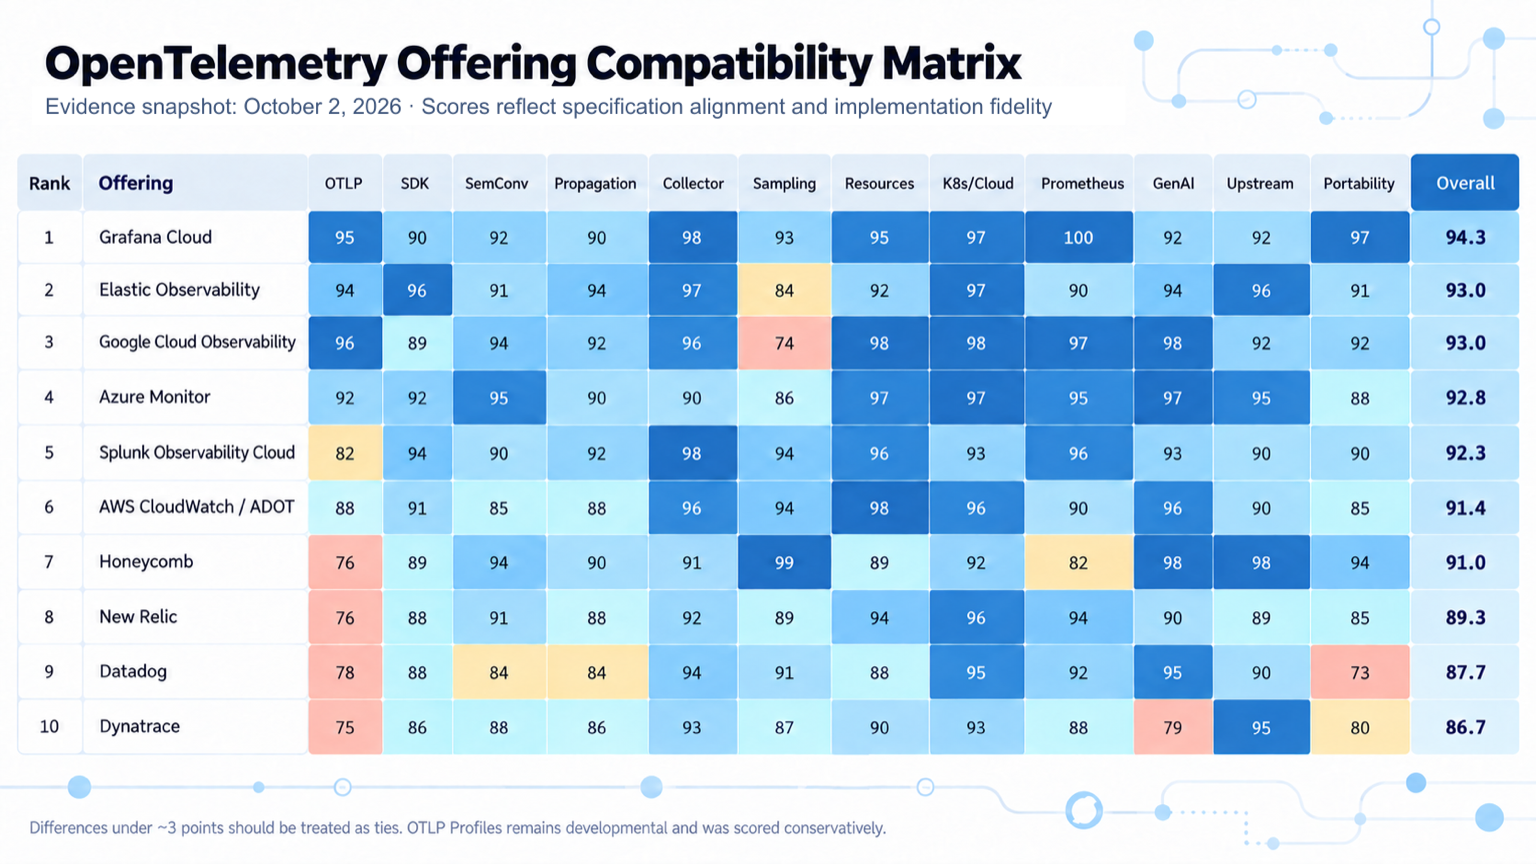
The matrix scores each offering in the twelve areas listed above for specification alignment and implementation fidelity, as of October 2, 2026. The overall score is the plain average of the twelve. Differences under about three points should be read as ties, so Elastic Observability through Honeycomb, ranked second to seventh, sit within two points of one another. OTLP Profiles is still developmental and was scored conservatively.
The five strongest offerings combined broad signal coverage, upstream-compatible components, clear documentation, solid semantic-convention handling, and a realistic path to move data elsewhere. The other five each made a specific contribution worth noting, even where their overall coverage was narrower.
The five strongest offerings
Grafana Cloud had the strongest result overall. Alloy is an open-source Collector distribution with more than 120 components and support for metrics, logs, traces, and profiles, and it can export to third-party backends, not only Grafana Cloud. Grafana's backends map directly to open projects: Mimir for metrics, Loki for logs, Tempo for traces, Pyroscope for profiles, plus deep Prometheus integration. Gaps: hosted OTLP data still has to map into the schemas of those underlying systems, and direct support for the OTLP Profiles service needs to be distinguished from Pyroscope pipelines.
Elastic Observability offers broad SDK, auto-instrumentation, Collector, Kubernetes, and cloud coverage through its OpenTelemetry Distribution. Elastic is also working upstream to bring the Elastic Common Schema (ECS) closer to OpenTelemetry semantic conventions. Gaps: some Elastic features are still ECS-based, profiles and tail sampling are less mature, and officially supported deployments favor Elastic's own distribution and agent. Elastic is moving large parts of its platform onto OpenTelemetry rather than converting OTLP at intake.
Google Cloud Observability has one of the strongest hyperscaler OTLP implementations. Its Telemetry API accepts traces, metrics, and logs and keeps resource, instrumentation-scope, and entity metadata. Managed OpenTelemetry for GKE (in Preview) and Prometheus integration add to that. Gaps: no documented OTLP Profiles ingestion and limited backend tail sampling. Google uses OpenTelemetry as a primary ingestion and metadata model rather than translating it into an older API.
Azure Monitor combines native OTLP support with strong resource correlation, Kubernetes support, and close alignment with the emerging GenAI semantic conventions. Gaps: ingestion paths differ in maturity, some accept only HTTP/protobuf, and some Application Insights features depend on specific temporality or histogram behavior. Microsoft is building OpenTelemetry into Azure and its agent-development tooling.
Splunk Observability Cloud ships one of the most mature vendor-supported Collector distributions, with broad component, Kubernetes, cloud, sampling, and Prometheus support. It makes large Collector deployments supportable in enterprise environments. Gaps: logs may go to Splunk Platform instead of Observability Cloud, and profiling usually follows proprietary paths rather than OTLP Profiles.
Five targeted contributions
- Honeycomb lacks documented OTLP Profiles ingestion and is less Prometheus-native than Grafana, but its adaptive tail-sampling work and its OpenTelemetry-first handling of high-cardinality telemetry and GenAI observability have moved sampling and semantic conventions forward.
- New Relic keeps the original OpenTelemetry attributes while normalizing data for its product features, and documents upstream Collector paths as real alternatives to its own distribution.
- Datadog has one of the broadest OpenTelemetry and GenAI compatibility ranges, although the full product experience still comes through Datadog's SDKs, agents, and distribution.
- Dynatrace contributes heavily upstream and offers a working pure-OpenTelemetry path, while some of its richest features still rely on OneAgent.
- AWS has built ADOT into a substantial upstream-based distribution and now ingests OTLP natively for traces, metrics, and logs, although several AWS features still depend on AWS-specific headers, agents, or entity-enrichment paths.
A single overall score hides contributions like these. A sampling processor, schema donation, conformance test, Collector component, or instrumentation library can improve the ecosystem without lifting a vendor's total score.
4. What useful compatibility evidence would contain
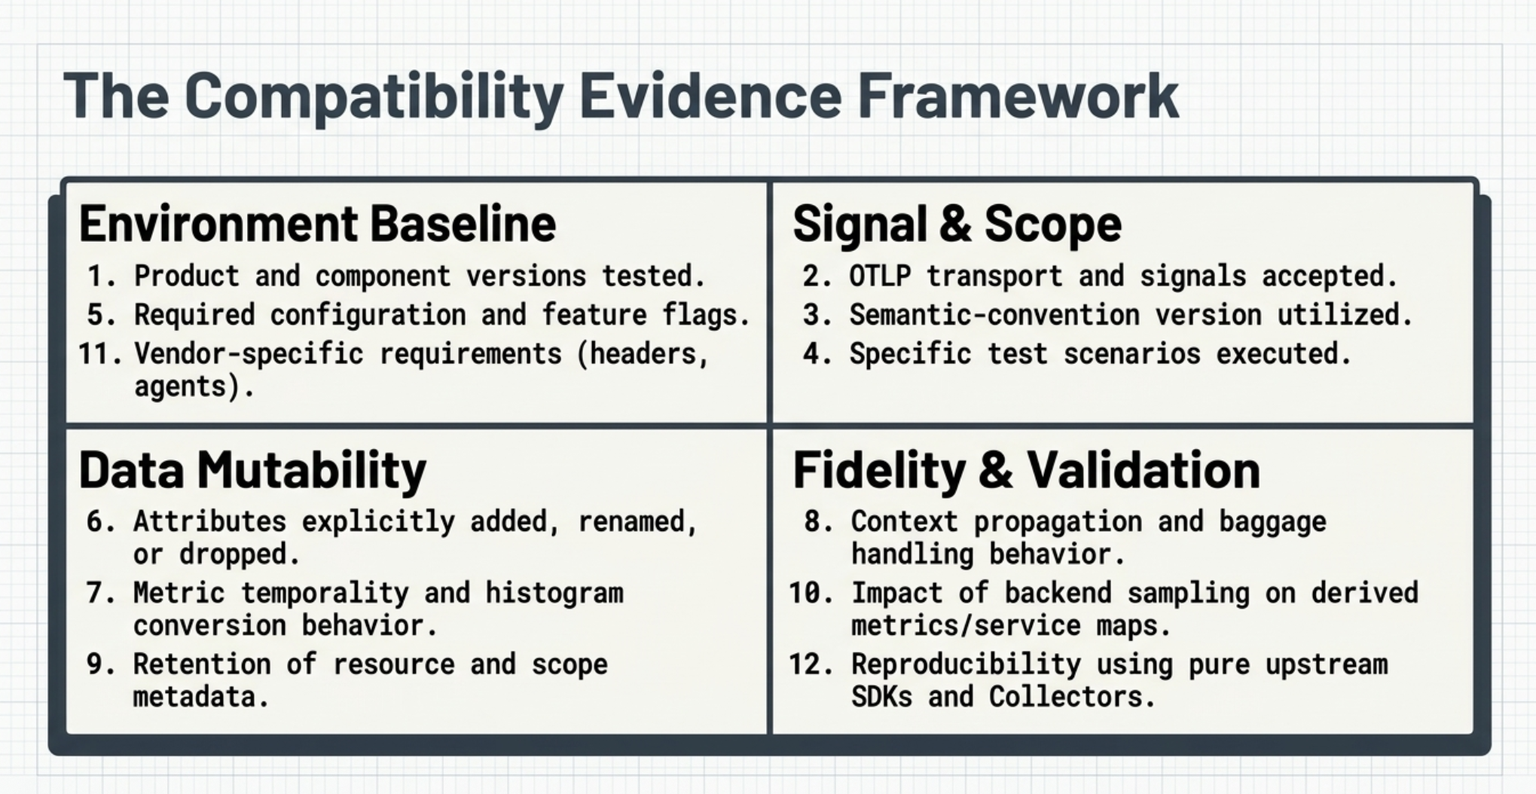
Self-reported compatibility badges don't answer the questions in Part 1. Repeatable evidence tied to a specific release and configuration would. At minimum, it should list:
- The product and component version tested
- The OTLP transport and signals accepted
- The semantic-convention version used
- The test scenarios run
- Required configuration and feature flags
- Attributes added, renamed, converted, or dropped
- Metric temporality and histogram changes
- Propagation and baggage behavior
- Whether resource and scope metadata are kept
- How sampling affects derived metrics and service maps
- Vendor-specific requirements
- Whether results reproduce with upstream SDKs and Collectors
The OpenTelemetry Ecosystem Explorer and the semantic-conventions conformance work already head this way: published intent, structured component metadata, and runtime measurements kept together instead of in separate sources. The project's investigation says that, in the long term, it would like projects to be able to demonstrate specific claims with repeatable checks. That would make "supports OpenTelemetry" a claim anyone can inspect.
Conclusion
Almost every major observability provider now accepts OpenTelemetry data, but the ten I compared still differ in how they store, transform, and expose it. Version-specific, repeatable test results are the most direct way to make those differences visible without forcing every backend to behave the same.
The OpenTelemetry post puts a question to its other SIGs: "We'd like to hear from other SIGs thinking about the same question: what evidence would actually be useful to their users?"
We at Integration Plumbers would like to extend the same question to our readers. What observability evidence is useful to you and your users?
What does it mean when a vendor says it supports OpenTelemetry?+
Under OpenTelemetry's vendor guidance, it means the vendor can accept the output of the default SDK, either through an exporter for the OpenTelemetry Collector or SDKs, or through a receiver for the OpenTelemetry protocol (OTLP). That covers intake only. A platform that meets it can still rename or drop attributes, convert metric temporality or histogram types, require vendor-specific headers or agents, or support some signals and not others.
Which observability platform has the best OpenTelemetry support?+
In this comparison, Grafana Cloud scored highest overall at 94.3, followed by Elastic Observability and Google Cloud Observability at 93.0. Differences under about three points should be treated as ties, so the per-area scores are more useful than the ranking. Honeycomb scored 99 for sampling, for example, while its OTLP score was 76. Start with the areas that matter most for your own pipelines.
How were the matrix scores calculated?+
Each offering received a score in each of twelve areas, reflecting specification alignment and implementation fidelity: OTLP, SDK, semantic conventions, propagation, Collector, sampling, resources, Kubernetes and cloud, Prometheus, GenAI, upstream participation, and portability. The overall score is the plain average of the twelve. The scores are a snapshot as of October 2, 2026, and OTLP Profiles, which is still developmental, was scored conservatively.
Is OTLP Profiles supported by observability backends?+
The OTLP specification is stable for traces, metrics, and logs, while profiles are still in development. Support among the offerings compared here is uneven. Google Cloud Observability and Honeycomb have no documented OTLP Profiles ingestion, Splunk's profiling usually follows proprietary paths, and Grafana's direct OTLP Profiles support needs to be distinguished from its Pyroscope pipelines.
What should I ask a vendor for before relying on its OpenTelemetry support?+
Ask for repeatable test results tied to a specific release and configuration: the product and component versions tested, the OTLP transports and signals accepted, the semantic-convention version used, the test scenarios run, required configuration and feature flags, attribute and metric changes, propagation and baggage behavior, whether resource and scope metadata are kept, how sampling affects derived metrics, vendor-specific requirements, and whether the results reproduce with upstream SDKs and Collectors.