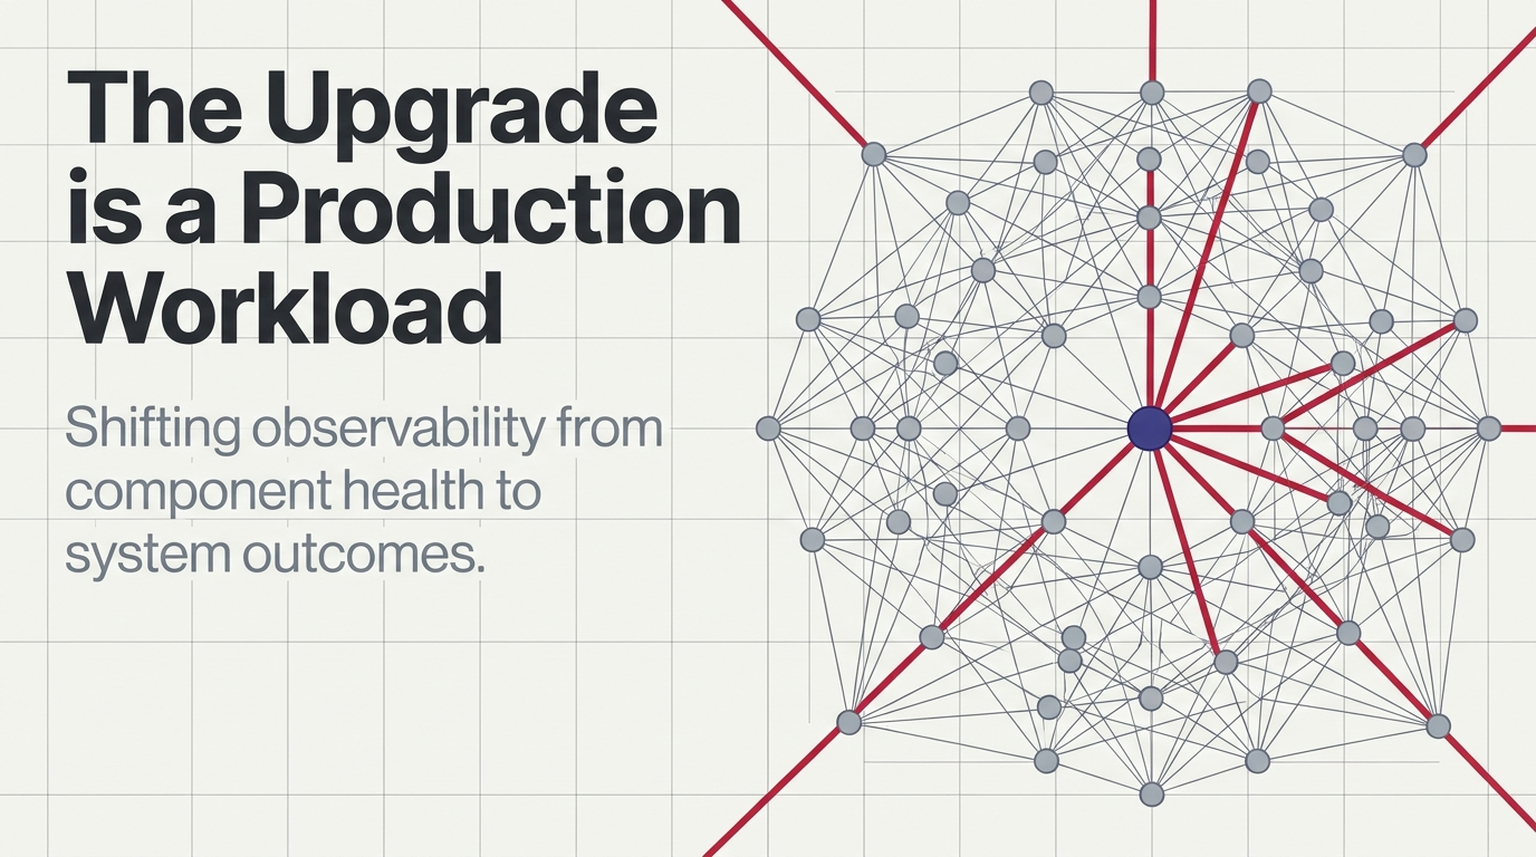
Last week, we explored why failover is a workload. Moving traffic away from a failed system does not make demand disappear. It changes where the pressure lands—and whether the surviving infrastructure can absorb it.
Last week's Microsoft 365 disruption and FAA ground stop raise a related question:
What happens when an infrastructure upgrade changes how work flows through the system?
Public reporting has linked both incidents to infrastructure changes, although they were separate events, and their detailed failure chains should not be treated as settled. The connection is not a shared technical cause. It is the operational challenge of changing a system while people depend on it.
An upgrade may be planned. Its effects still have to be discovered, understood, and controlled in production.
An improvement is also a change in behavior
Infrastructure upgrades come with a reasonable expectation: more capacity, better reliability, newer technology, or fewer operational constraints.
But an upgrade does not happen outside the system. It changes the system.
Reporting on the Microsoft disruption connected the incident to a network-capacity upgrade. The FAA disruption occurred during a communications modernization effort, with preliminary accounts pointing to a router-related problem. Those accounts provide a starting point for discussion—not a substitute for completed technical investigations.
The broader engineering question is worth asking before the final reports arrive:
When we change one part of a system, how will we know whether the rest of it is coping?
A change plan can describe the intended outcome precisely. The observability plan needs to reveal the unintended behavior.
Watch the work, not just the component
Consider a hypothetical service experiencing intermittent connection failures after a network change.
Some requests fail. Clients retry. The retries create more connection attempts. Resource consumption rises, while successful transactions fall.
A dashboard focused on activity might show a busy system. A dashboard focused on outcomes would show a service making less progress.
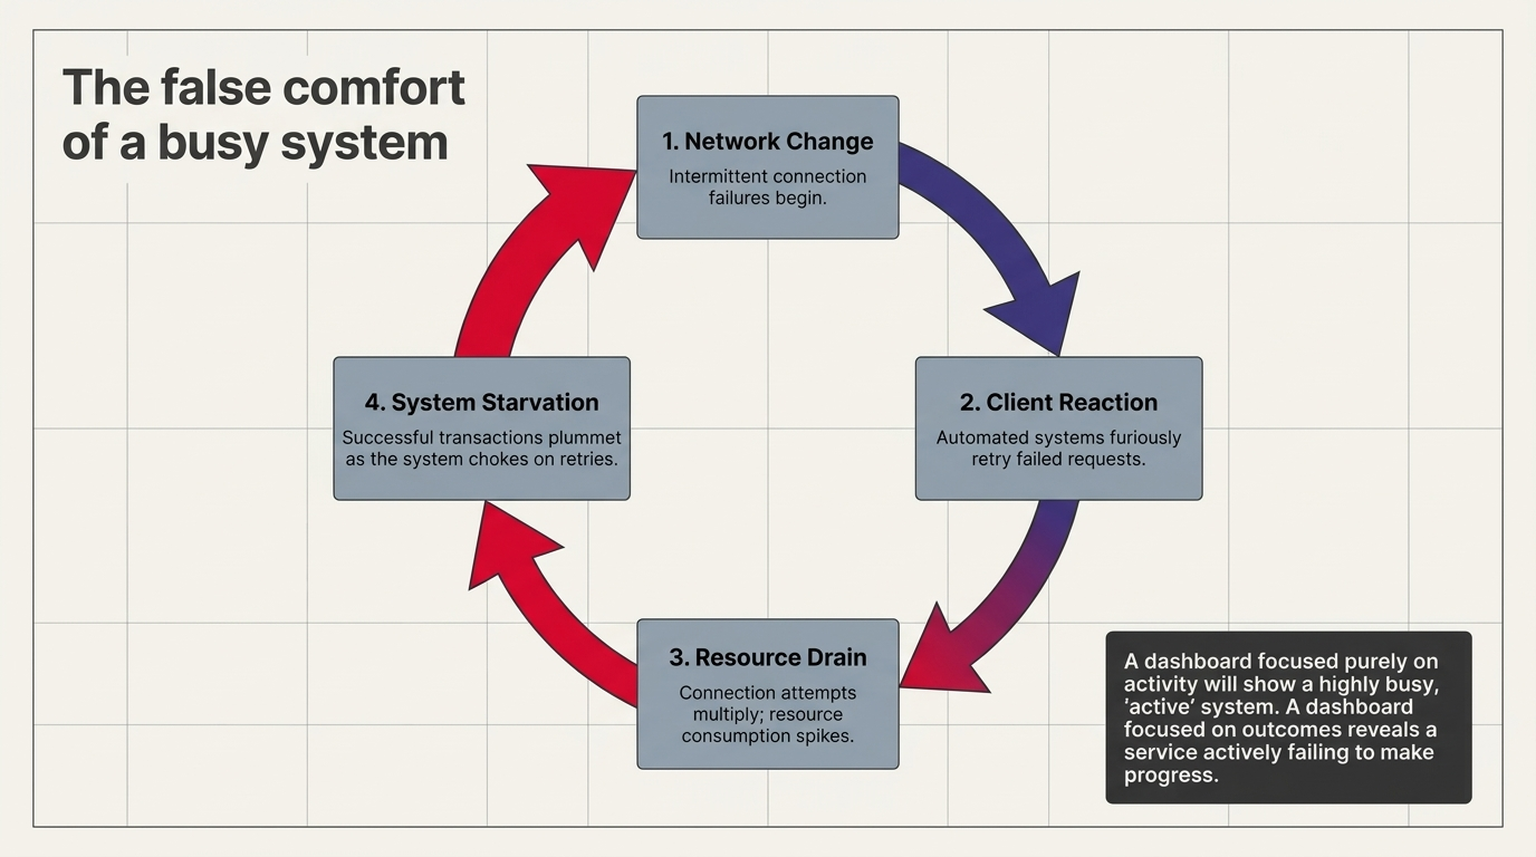
That distinction should shape what we measure during a change.
Rather than asking only whether the upgraded component is available, a useful observation plan would ask:
- Are users completing the operations they came to perform?
- Are successful transactions keeping pace with incoming demand?
- Are retries growing faster than useful throughput?
- Are queues draining, or merely holding work that will fail later?
- Is the impact contained to the changed environment, or spreading into dependencies?
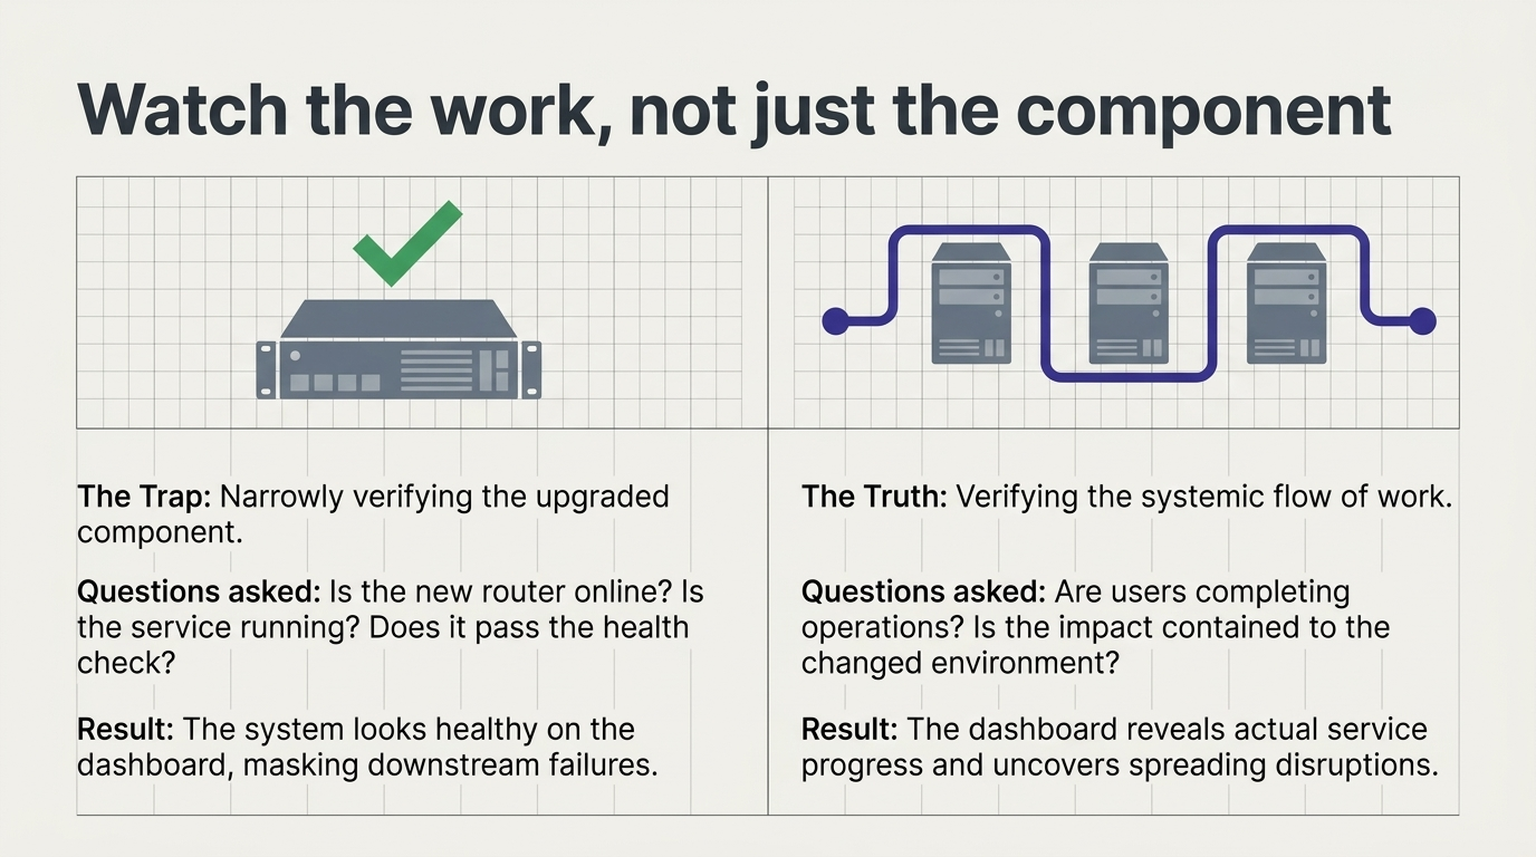
These are not claims about what Microsoft or the FAA did or did not monitor. They are questions we can apply to our own change procedures.
A system can become busier while delivering less. Our dashboards need to distinguish activity from progress.
Where OpenTelemetry helps
OpenTelemetry provides APIs, instrumentation, and collection mechanisms for telemetry such as traces, metrics, and logs. Its Collector provides a vendor-neutral way to receive, process, and export that data. These are building blocks for understanding system behavior—not an automatic mechanism for preventing outages.
For infrastructure changes, I would organize their use around three questions.
1. What changed, and where?
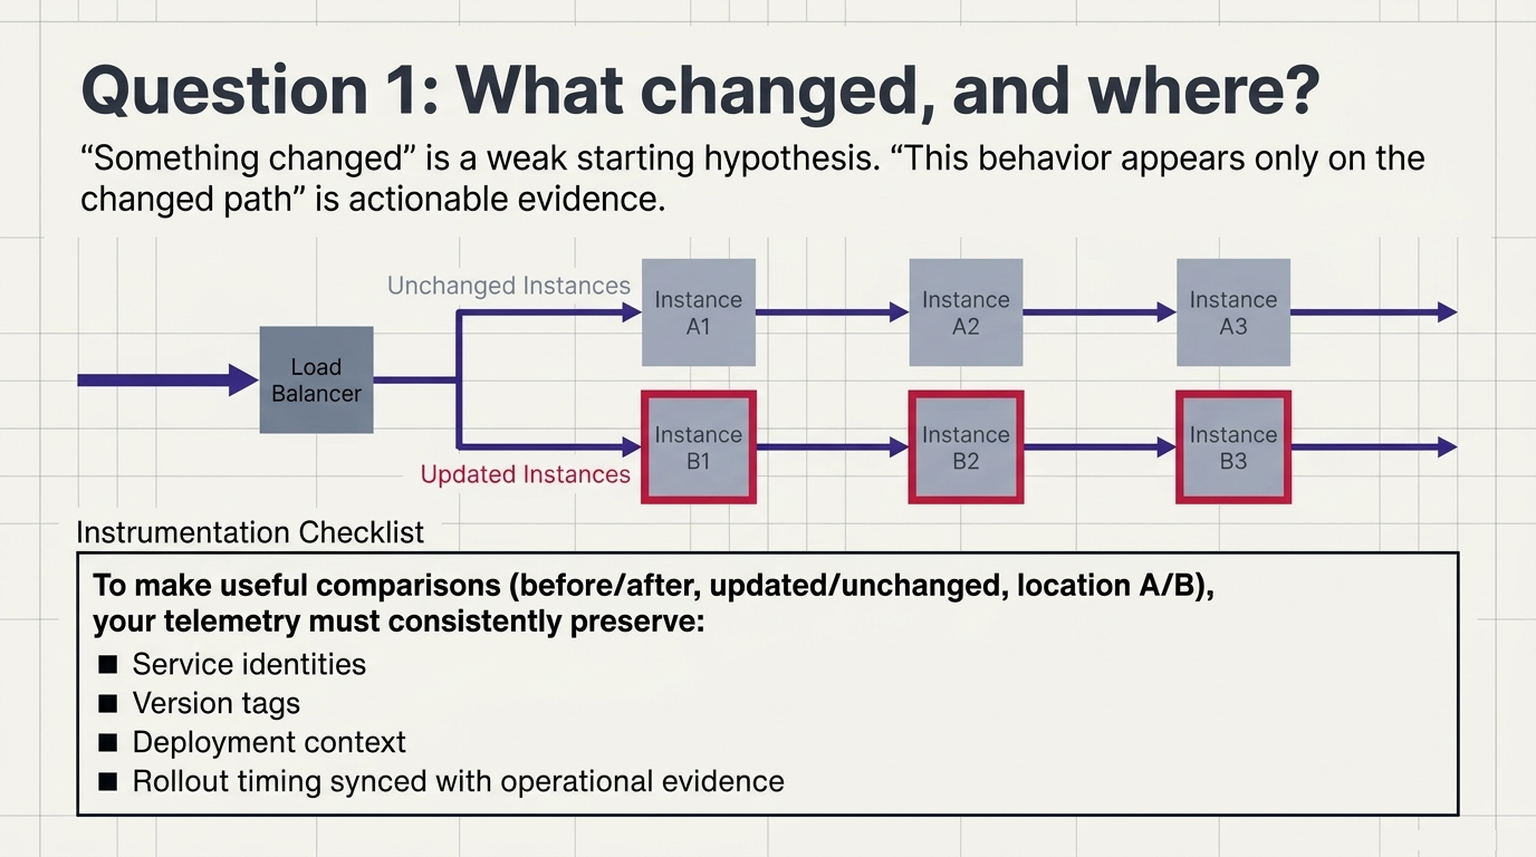
Start by making the changed environment distinguishable from the unchanged environment.
A practical instrumentation plan should preserve relevant service identities, versions, and deployment context. The investigation workflow should also make change records and rollout timing available alongside operational evidence.
OpenTelemetry's instrumentation and attributes provide building blocks for describing the systems producing telemetry. Teams still need to decide which context matters and apply it consistently.
The goal is not to blame the most recent deployment automatically.
It is to make useful comparisons possible:
- Before the change versus after it.
- Updated instances versus unchanged instances.
- One location versus another.
- Requests passing through the changed path versus those taking another route.
"Something changed" is a weak starting point. "This behavior appears only on the changed path" is a much more useful hypothesis.
2. Where is useful work slowing down?
Metrics, traces, and logs provide different views of system behavior. Distributed traces can help follow requests through instrumented services, while metrics and logs provide additional evidence about performance and failures.
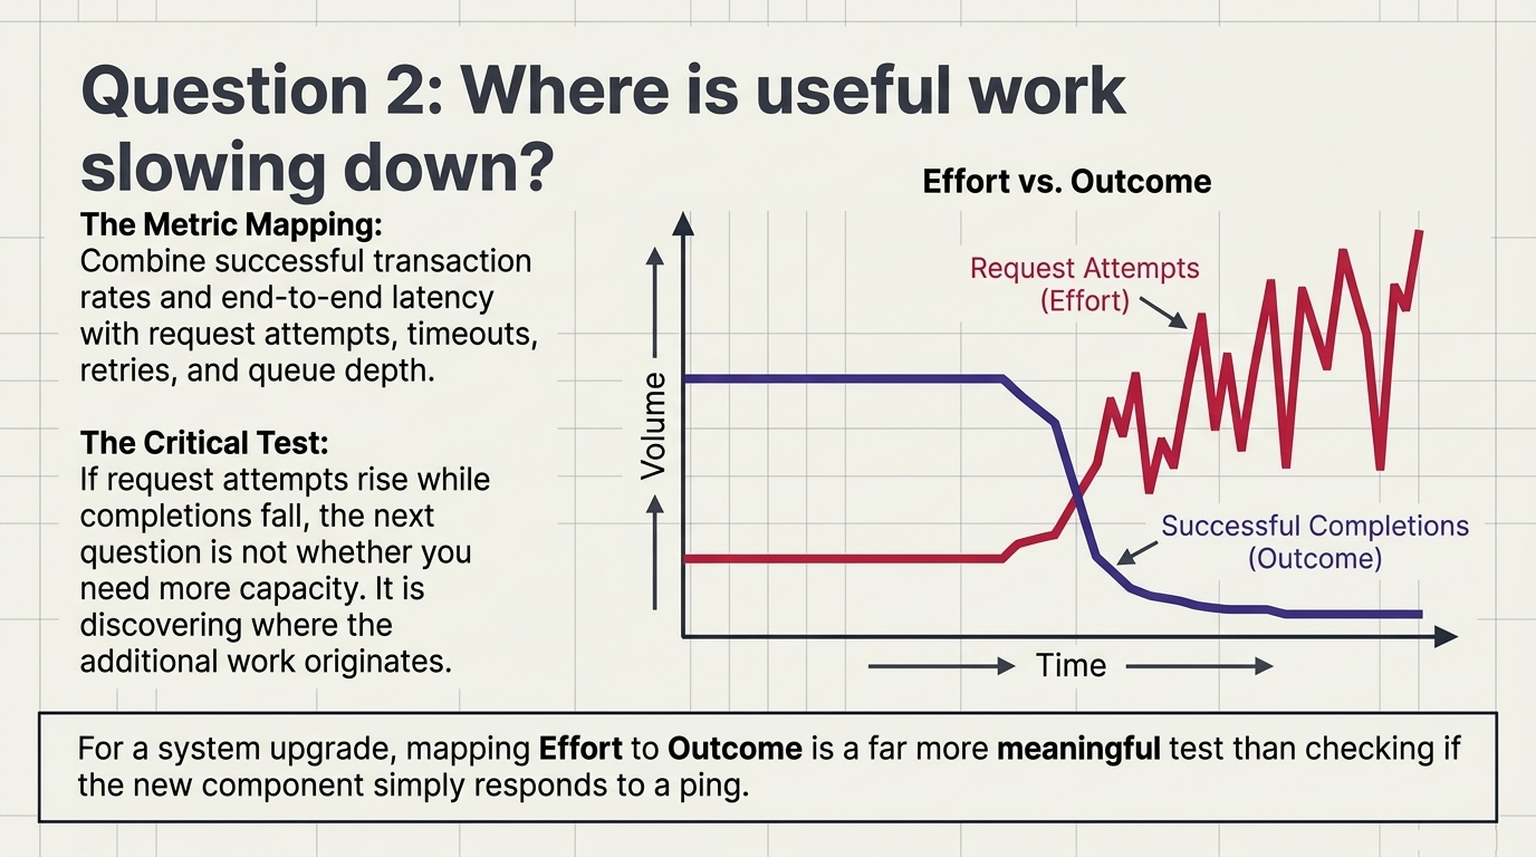
A proposed change dashboard might combine successful transaction rates and end-to-end latency with request attempts, timeouts, retries, and queue depth.
The important relationship is between effort and outcome.
If request attempts rise while completions fall, the next question is not simply whether more capacity is needed. It is where the additional work originates and whether it contributes to recovery.
For an upgrade, that is a more meaningful test than whether the new component responds to a health check.
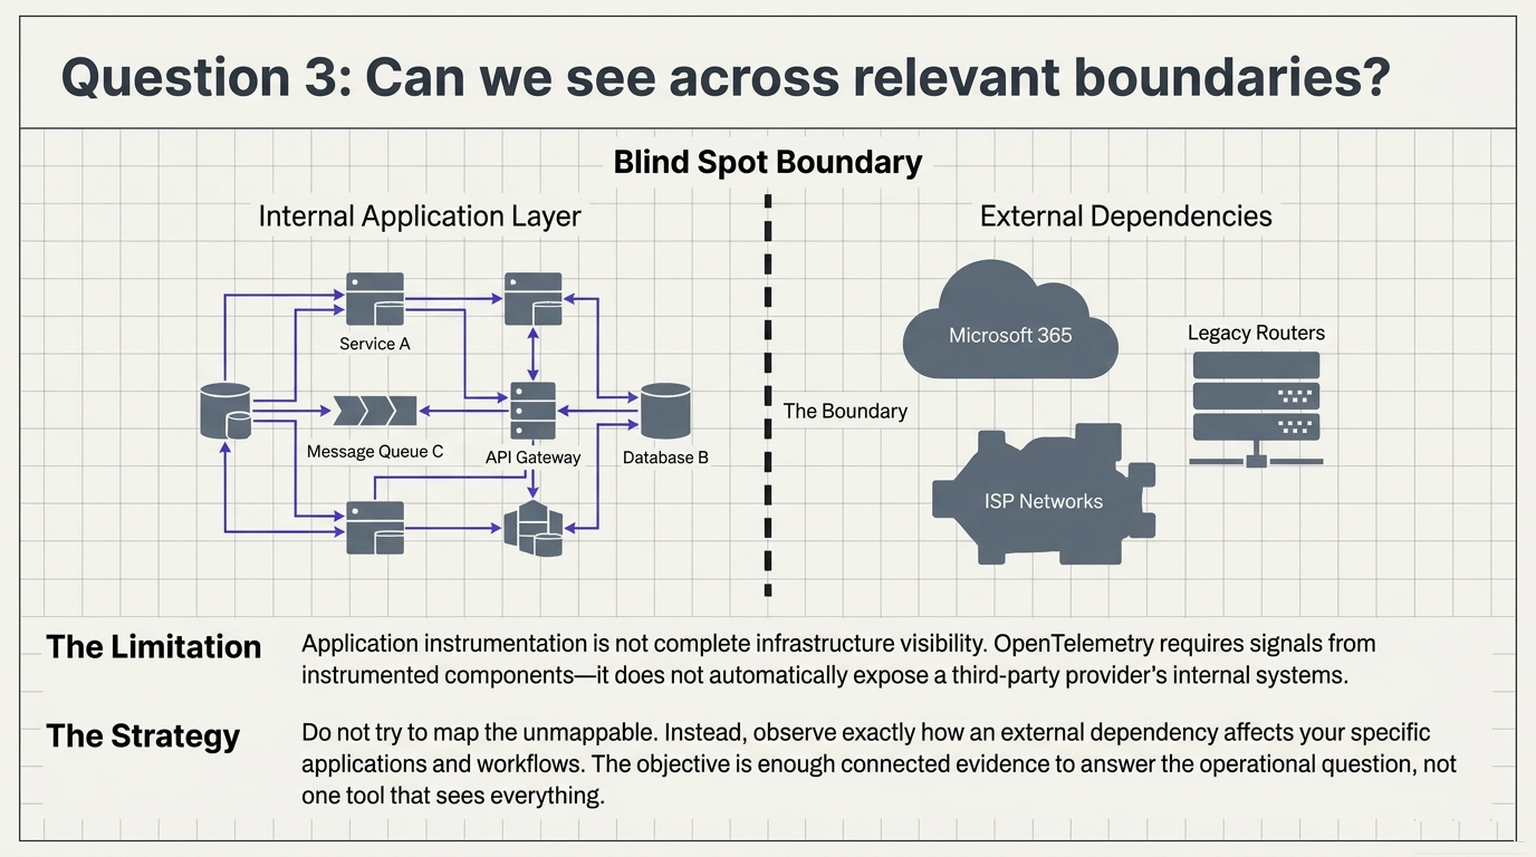
3. Can we see across the relevant boundaries?
Application instrumentation is not the same thing as complete infrastructure visibility.
OpenTelemetry requires signals from instrumented components, and the Collector's ability to receive telemetry depends on available components and integrations. It does not automatically expose every router, legacy platform, or external provider's internal systems.
That limitation matters.
For a network modernization project, the observation plan should identify which network and infrastructure signals must accompany application telemetry.
For an organization dependent on Microsoft 365, the achievable view is different: observe how that dependency affects your applications and workflows without claiming visibility into Microsoft's internal failure chain.
The objective is not one tool that sees everything. It is enough connected evidence to answer the operational question.
Visibility needs a decision attached
The practical lesson is not "collect more telemetry."
It is to decide, before a change, which evidence will govern the next action.
A useful change review should answer:
- What does healthy service delivery look like during the rollout?
- Which deviations are acceptable, and for how long?
- What evidence would trigger a pause?
- What would justify rollback rather than continued diagnosis?
- How will we verify that recovery is real, rather than a temporary reduction in symptoms?
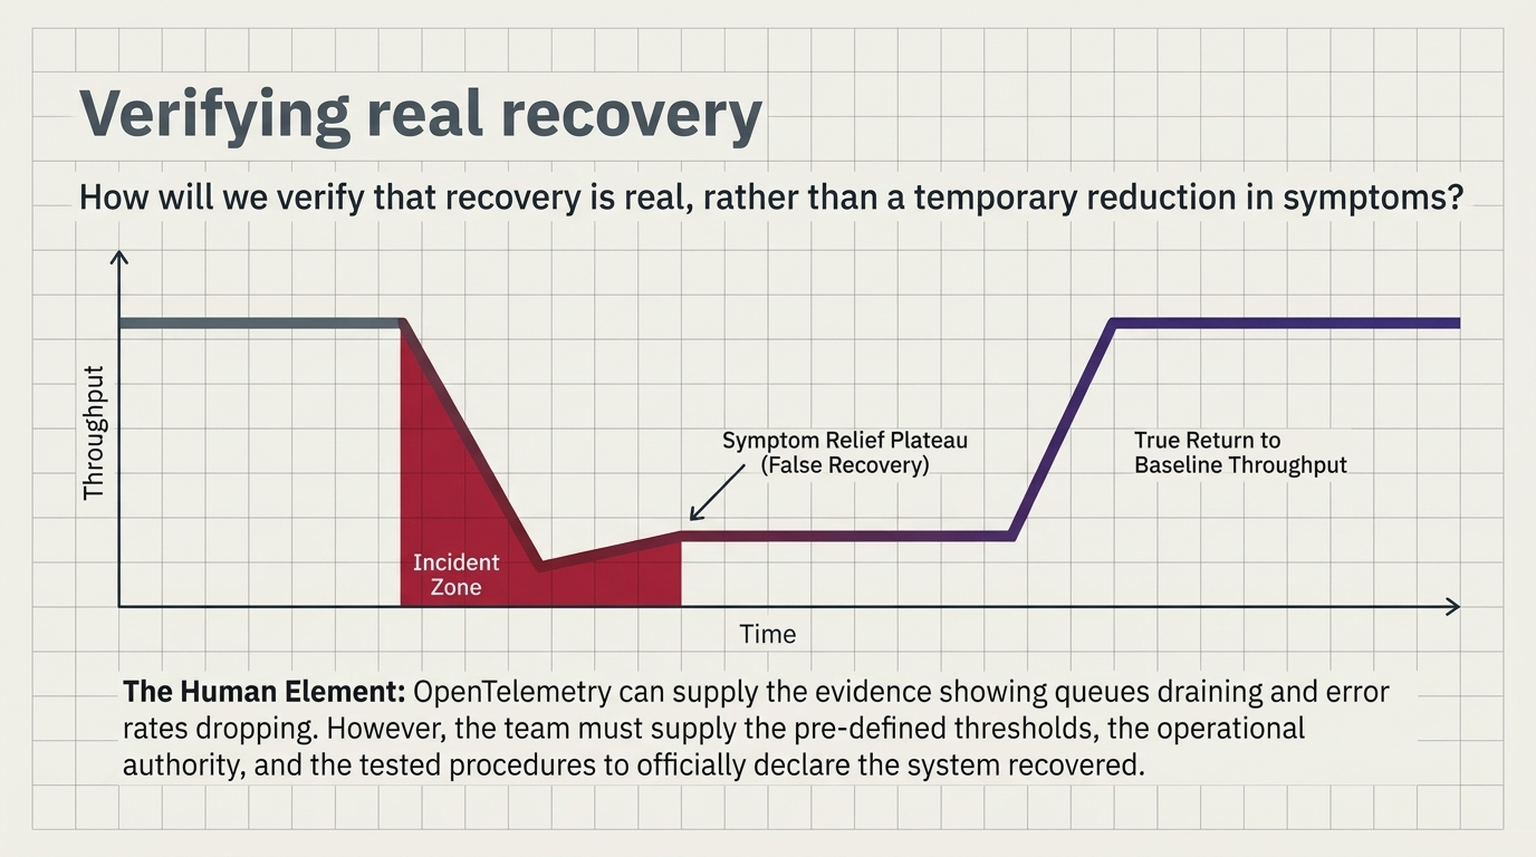
OpenTelemetry can supply part of the evidence. The team must supply the thresholds, authority, and tested procedures for acting on it.
That distinction keeps observability in its proper role: supporting operational judgment rather than standing in for it.
Treat change as something the system must carry
Last week's question was whether the destination could handle the workload after failover.
This week's question is whether the system can handle the transition while an upgrade is underway.
Both lead to the same design challenge: observe service delivery across the system, not just the health of the component receiving attention.
Before the next infrastructure upgrade, ask two questions:
"What do we expect this change to improve?"
And then:
"How will we know if it is making the system worse?"
What happened in the Microsoft 365 and FAA incidents?+
On November 12, 2026, a Microsoft 365 disruption affected Outlook, Teams, Exchange Online, and other services. Microsoft said it was introduced by an issue during an earlier network capacity upgrade that surfaced after a recent network change. On November 13, the FAA ordered a nationwide ground stop while a contractor was replacing copper lines with fiber across its telecommunications network, and it linked the problem to a newly installed router. They were separate events, and their detailed failure chains should not be treated as settled.
Why can a busy system be making less progress?+
When requests fail, clients retry them. Each retry is another connection attempt, so resource consumption rises while successful transactions fall. A dashboard that shows activity sees a busy system; one that shows outcomes sees a service completing less work.
What should a dashboard show during an infrastructure change?+
Successful transaction rates and end-to-end latency, alongside request attempts, timeouts, retries, and queue depth, broken down so the changed path can be compared with the unchanged one: before and after, updated and unchanged instances, and one location against another. For a network change, it should also include the network and infrastructure signals that sit below the application.
What should a change review decide before an upgrade starts?+
What healthy service delivery looks like during the rollout, which deviations are acceptable and for how long, what evidence triggers a pause, what justifies rollback rather than continued diagnosis, and how the team will verify that recovery is real rather than a temporary reduction in symptoms.