If you're running Node services, wiring AI agents into your development workflow, or keeping Prometheus alive in production, this week touched your stack.
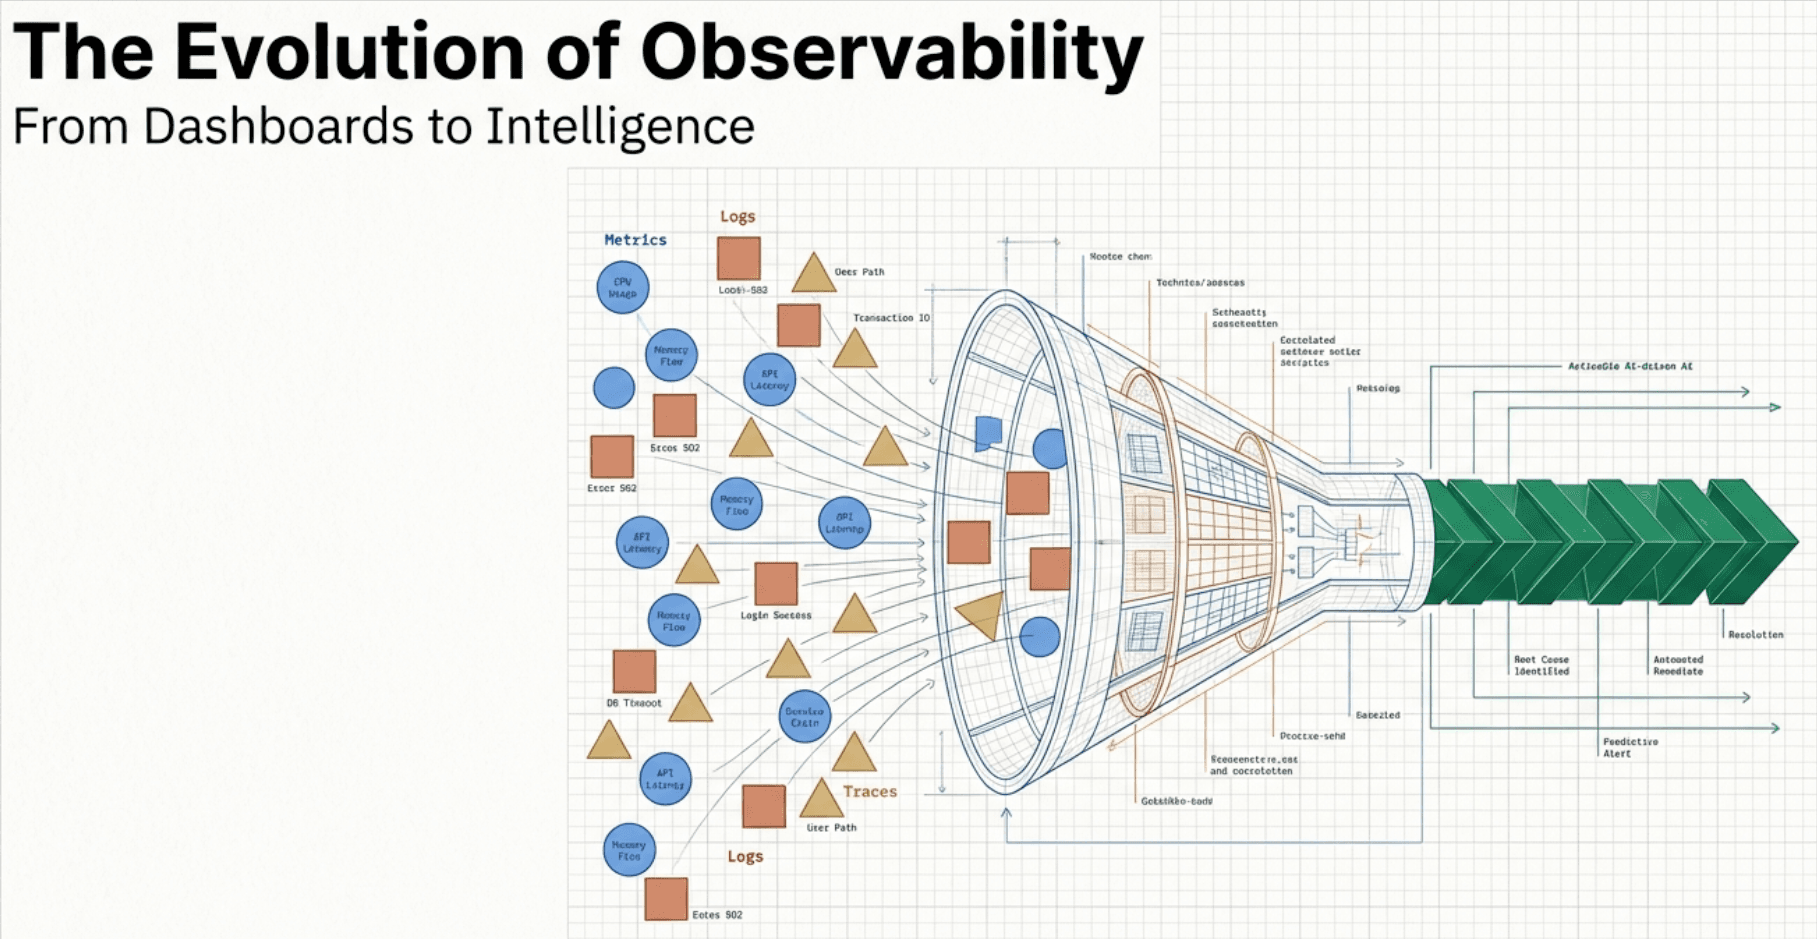
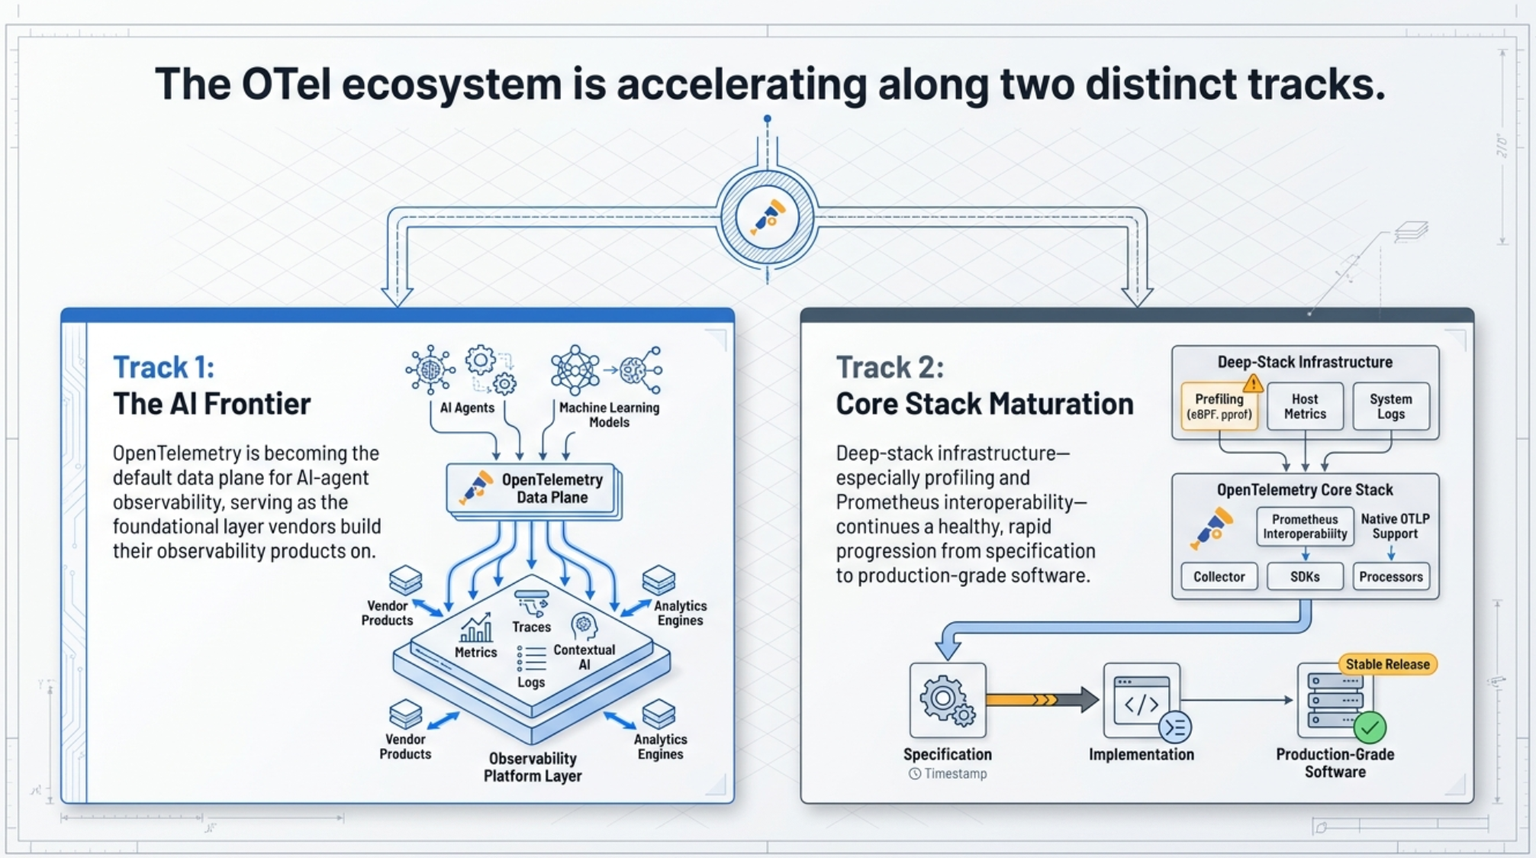
The bottom line: OpenTelemetry is becoming the default data plane for AI-agent observability, and increasingly the foundation that vendors build their observability products on. Meanwhile, less visible work deep in the stack, especially profiling, keeps maturing at a healthy pace.
Part 1: Five developments that matter
-
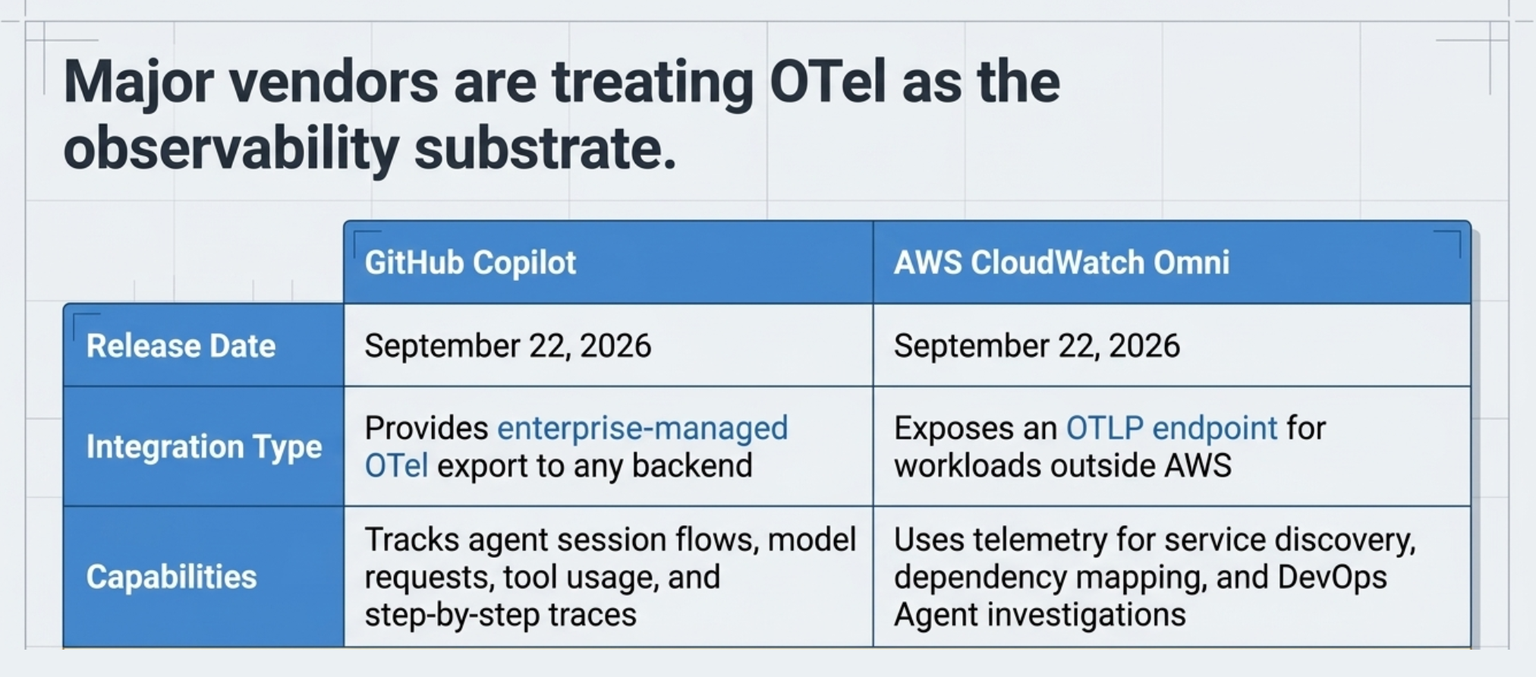
GitHub brought OpenTelemetry to the Copilot app on September 22. Administrators can now configure OTel export through enterprise-managed settings. That sends agent session flows, model requests, tool usage, and step-by-step execution traces to any compatible backend. Prompt and response content is excluded by default. This builds on the enterprise-managed OTel export for VS Code and the CLI that shipped in July. (changelog) Takeaway: AI coding agents are becoming production systems in their own right, and GitHub is treating OTel as the standard way to observe them. For platform teams, agent activity can now land on the same dashboards as the services those agents touch.
-
AWS launched CloudWatch Omni on September 22, and it's built on OpenTelemetry. Omni combines application and agent observability and exposes an OTLP endpoint for workloads running outside AWS. It uses that telemetry to discover services, map dependencies, and ground the investigations run by Amazon DevOps Agent. (AWS News Blog) Takeaway: AWS isn't treating OTel as just one more ingestion option. It's the substrate underneath an AI-driven observability control plane. Telemetry already flowing to CloudWatch shows up in Omni with nothing to reconfigure, and OTel-instrumented workloads elsewhere only need to point their exporters at its OTLP endpoint.
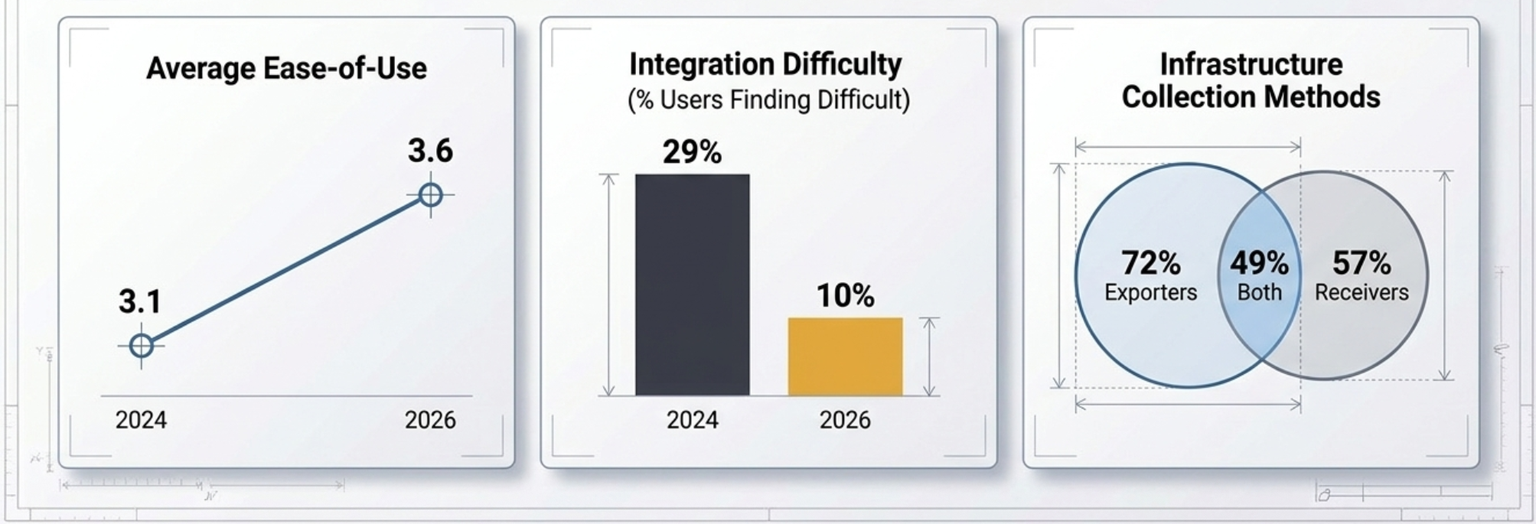
- The 2026 Prometheus/OpenTelemetry interoperability survey shows real progress. The results were published September 21 and draw on 81 active OTel-for-metrics users. The average ease-of-use score rose from 3.1 in 2024 to 3.6. The share of respondents who called using the two together difficult fell from 29% to 10%. For collecting infrastructure metrics, 72% use Prometheus exporters, 57% use OTel receivers, and 49% use both. (Prometheus blog) Takeaway: OTel isn't replacing Prometheus. It is increasingly becoming the collection and normalization layer around it. If your teams have been holding off on OTel because of Prometheus investments, that tradeoff is shrinking.
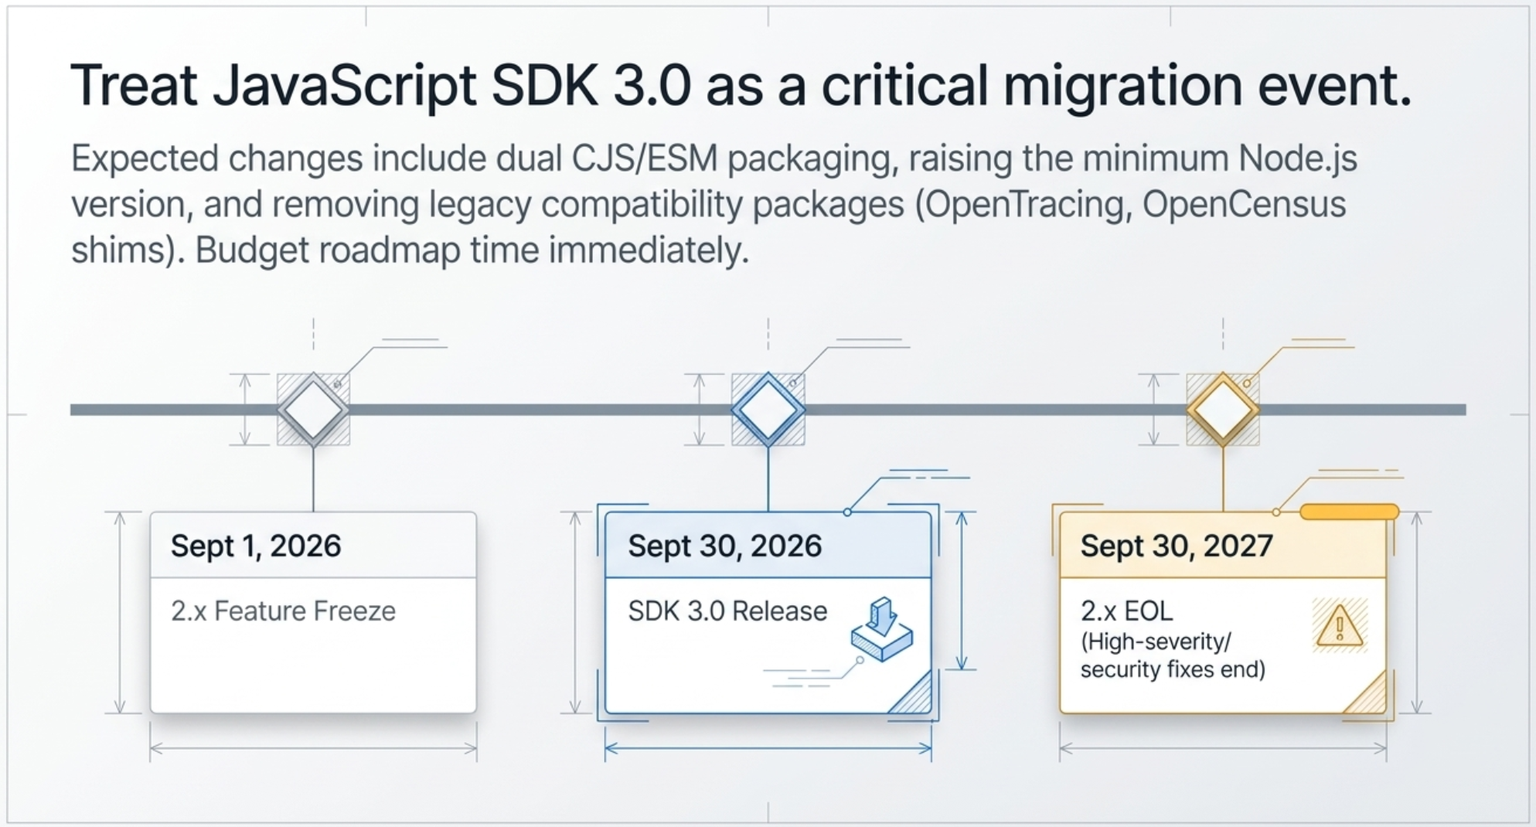
- JavaScript SDK 3.0 is scheduled for September 30. The 2.x line entered feature freeze on September 1. SDK 3.0 is expected to clean up the public APIs, move to proper dual CJS/ESM packaging, raise the minimum Node.js version, and remove legacy compatibility packages such as the OpenTracing and OpenCensus shims and the Jaeger propagator. 2.x will continue to receive high-severity and security fixes through September 30, 2027. (SDK 3.0 release plan) Takeaway: If your organization has Node instrumentation, treat this as a real migration event, not a routine upgrade. Budget time for it and put it on the roadmap now.
- The GenAI semantic conventions keep evolving quickly. Proposals under review cover how agents and tool calls are represented, inference-duration metrics, token usage on response spans, streaming attributes, execution-state events, agent turns, skills, and agent-to-agent interactions. (GenAI semantic conventions) Takeaway: In our view this is one of the most strategically important areas of OTel right now. The industry is negotiating the vendor-neutral telemetry model for autonomous agents in real time. Items 1 and 2 show what's at stake: whatever these conventions settle on is what GitHub, AWS, and everyone else will emit and consume.
Part 2: Profiling, the quieter story
Profiles entered public alpha in March. Since then, the work has focused on semantics and standardization. Contributors are actively refining the OTLP Profiles wire format. Recent PRs clarify profile duration and semantics, add development-version metadata, and improve how original payloads are represented.
On the implementation side, the OTel eBPF Profiler already implements the alpha Profiles signal. It supports mixed-stack profiling across native code, JVM, Python, Node.js, .NET, Ruby, PHP, and more. It runs as an OpenTelemetry Collector receiver and ships as an official Collector distribution.
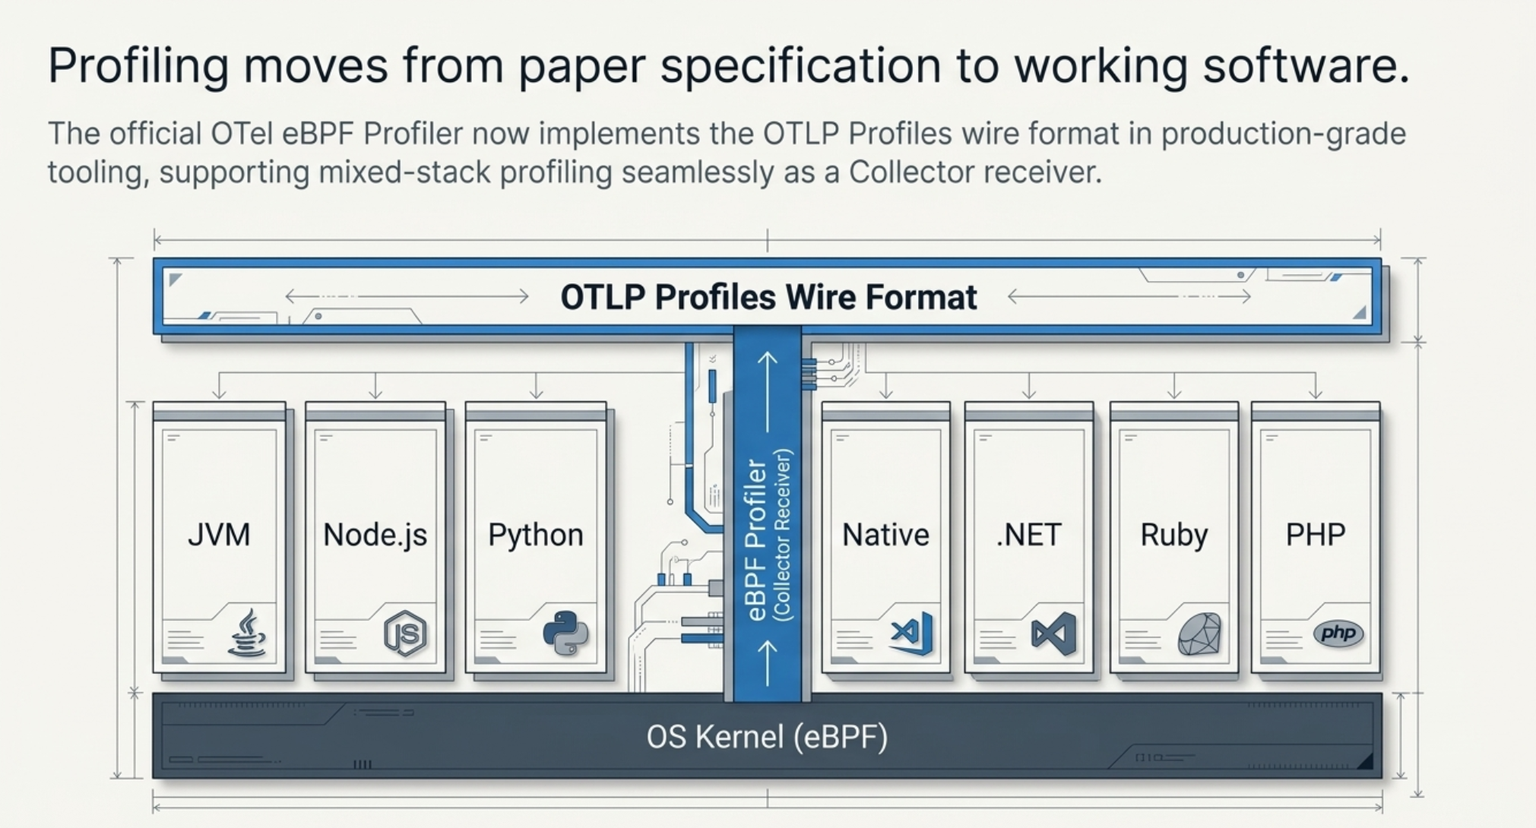
Takeaway: A spec only proves itself once it's running in production-grade tooling. The eBPF profiler is the strongest sign yet that Profiles is becoming usable and not remaining a paper specification. This is the space to watch.
Wrapping up
This week made it clear that OpenTelemetry has become the common language for AI-agent observability. GitHub and AWS both built on it rather than around it. The fundamentals underneath are keeping pace: Prometheus interoperability is measurably easier, and profiling is moving from spec to working software.
For the teams we work with, that means the investment in OTel keeps paying off. The same pipeline that carries today's service telemetry is the one your AI agents, and soon your profiles, will flow through.
Next steps if you're acting on this:
- Node teams: Audit your OTel JS dependencies for the OpenTracing and OpenCensus shims, and plan your 3.0 migration.
- Platform teams adopting AI agents: Turn on Copilot's OTel export and route it through your existing Collector.
- Anyone curious about profiling: Try the eBPF profiler in a non-production cluster alongside the Collector.
Is OpenTelemetry replacing Prometheus?+
No. The 2026 Prometheus/OpenTelemetry interoperability survey points the other way: 72% of respondents collect infrastructure metrics with Prometheus exporters, 57% with OTel receivers, and 49% with both. OpenTelemetry is increasingly the collection and normalization layer around Prometheus. Running the two together is also getting easier: the share of respondents who called it difficult fell from 29% in 2024 to 10% in 2026.
What changes in OpenTelemetry JavaScript SDK 3.0, and when?+
SDK 3.0 is scheduled for September 30, 2026. It is expected to clean up the public APIs, move to dual CJS/ESM packaging, raise the minimum Node.js version, and remove legacy compatibility packages, including the OpenTracing and OpenCensus shims and the Jaeger propagator. The 2.x line has been in feature freeze since September 1 and receives high-severity and security fixes through September 30, 2027. Start by auditing your dependencies for the shims.
Does GitHub Copilot's OpenTelemetry export include prompts and responses?+
Not by default. Administrators configure the export through enterprise-managed settings, and it sends agent session flows, model requests, tool usage, and step-by-step execution traces to any compatible backend. Prompt and response content is excluded by default. Because it is standard OTel, you can route it through the Collector you already run.
What is Amazon CloudWatch Omni?+
An AWS observability service, launched September 22, 2026, that combines application and agent observability and is built on OpenTelemetry. It exposes an OTLP endpoint for workloads running outside AWS, and uses that telemetry to discover services, map dependencies, and ground the investigations run by Amazon DevOps Agent. Telemetry you already send to CloudWatch appears in Omni with nothing to reconfigure, and OTel-instrumented workloads elsewhere point their exporters at its OTLP endpoint.
Is OpenTelemetry profiling ready to use?+
The Profiles signal entered public alpha in March 2026, and the OTLP Profiles wire format is still being refined. The OTel eBPF Profiler already implements the alpha signal, supports mixed-stack profiling across native code, JVM, Python, Node.js, .NET, Ruby, PHP, and more, and ships as an official Collector distribution. A reasonable next step is to try it in a non-production cluster alongside your Collector.