A query that ran in forty milliseconds last Tuesday now takes four seconds. Nobody changed the SQL. Somebody asks the reasonable question, what is it doing differently, and the honest answer is that nobody knows, because the plan it ran last Tuesday is gone. PostgreSQL chooses a plan, runs it, and discards it. By the time a person goes looking, the only plan available is the one EXPLAIN produces right now, which is a guess about the present rather than a record of the past.
That is the gap this part of the release closes. Plan Analysis keeps the plan a slow query actually ran, written to the server log by auto_explain during the query's own execution, and checks it against five detection rules. The Plan Drift Advisor builds on the same captures: it keeps accepted baseline plans for each query and tells you, on the page and through an ordinary Oracle Enterprise Manager alert, when a query leaves them.
This is the second of four posts on the advisory features in the PostgreSQL Plug-in for Oracle Enterprise Manager. The first covered the Index Advisor. This one covers how plans are captured without re-running anything, what the five rules look for, how drift detection decides a plan has regressed, how to prove a fix before it ships, and the one prerequisite that is yours to decide.
Capturing the plan without re-running the query
Plan capture is passive: auto_explain writes each qualifying statement's plan to the PostgreSQL server log while that statement runs, complete with the actual row counts and timings from the real execution. The plug-in reads those plans back out of the log, so every plan it shows is the one the query actually ran.
The reading happens over the JDBC connection the plug-in already holds: it finds the current log file with pg_current_logfile() and reads it with pg_read_file(). There is no operating-system file access, which means capture behaves the same whether the monitoring agent sits on the database host or somewhere else on the network. If the log cannot be read, the harvest is skipped with a warning and the rest of the collection carries on.
Each capture is stored on the agent with its full plan tree, the query text, the query id, the capture time, and the execution statistics. Plan bodies stay on the agent. Nothing plan-body-sized goes to the Enterprise Manager repository. Captures are kept for 90 days by default, and the archive is also bounded by a 100 MB ceiling that evicts the oldest captures first. Any capture that represents an accepted baseline is exempt from both limits, so the plan behind each accepted baseline stays in the archive.
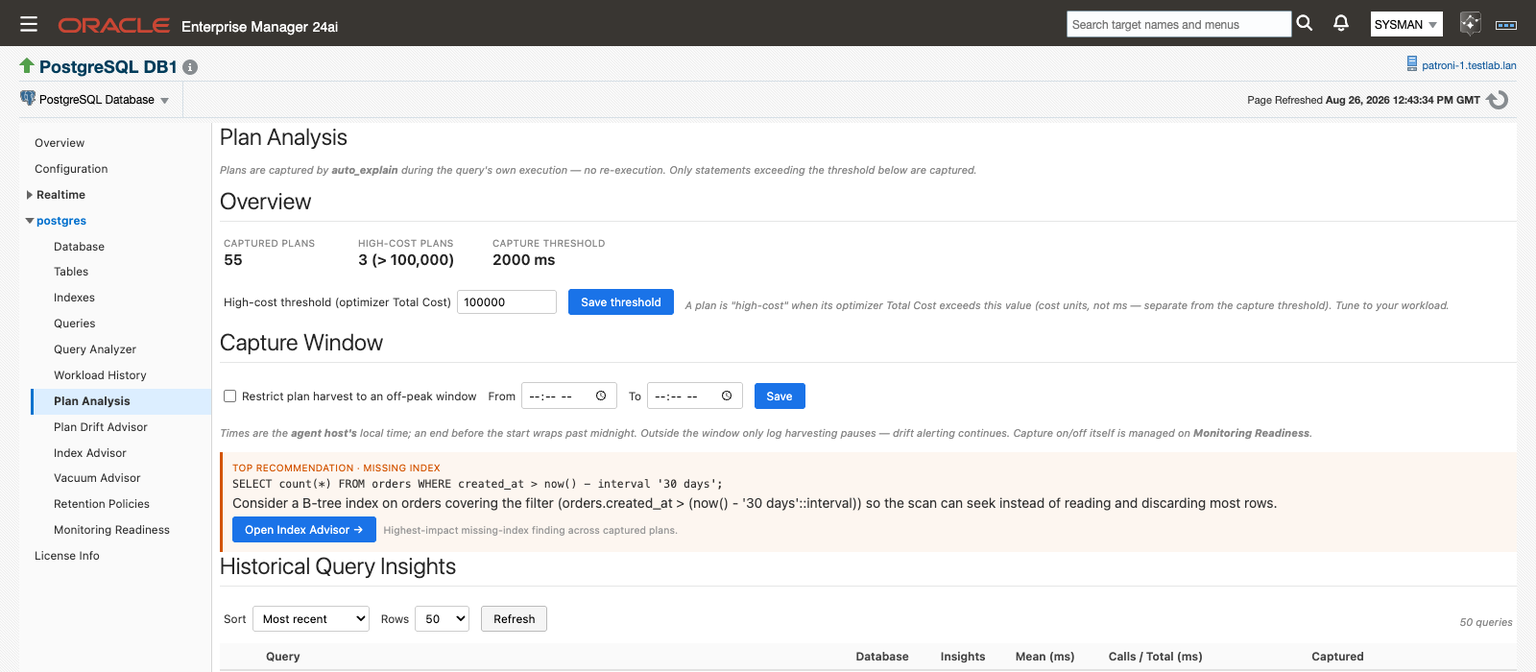
Plan Analysis uses two thresholds, and they are measured in different units:
| Setting | Unit | What it decides |
|---|---|---|
auto_explain.log_min_duration | Milliseconds of execution time | Which statements get captured at all. Anything running longer than this has its plan written to the log; -1 turns capture off |
| High-cost threshold | Optimizer cost units | Which already-captured plans get labeled high-cost. It changes nothing about what is captured |
The first decides which plans the plug-in captures. The second only moves a line on a KPI tile. Raising the high-cost threshold does not make capture quieter, and lowering log_min_duration does not make any plan look worse. The page's own hint says so plainly: cost units, not milliseconds. The default high-cost line of 100,000 is a starting point, because cost units mean different things on different instances.
Two smaller details round this out. If a captured plan arrives without a query id, usually because compute_query_id or auto_explain.log_verbose is off, the plug-in computes a synthetic syn: id from the normalized query text, and grouping, history, drift detection, and baselines all keep working on it. Turning the real query ids on later is fine; the affected statements simply start a fresh history under their new ids. And harvesting can be confined to an off-peak Capture Window, set in the agent host's local time. Outside the window only harvesting pauses; drift alerting continues.
Five things wrong with a plan
Every newly captured plan is checked against five detection rules in this release. Each finding carries a severity, and in practice that is Medium or High: none of the five fires below Medium.
| Insight | What it detects | Typical recommendation |
|---|---|---|
| Insufficient Index | A sequential scan that reads many rows, throws most of them away through its filter, and returns only a few | A B-tree index on the filter columns, so the scan can seek instead of reading and discarding |
| Misestimate | A plan node whose estimated row count is far from the rows it actually produced, in either direction | Run ANALYZE on the table; if the gap persists, raise the statistics target on the filter or join columns |
| Stale Statistics | A scanned table analyzed a long time ago, or never | Run ANALYZE; if it keeps going stale, lower autovacuum_analyze_scale_factor for that table |
| Slow Sequential Scan | A sequential scan discarding a large absolute number of rows by filter | A selective index, or a query refined so PostgreSQL stops scanning and filtering the whole table |
| Lossy Bitmap | A Bitmap Heap Scan whose bitmap outgrew work_mem and went lossy, rechecking whole pages instead of individual rows | Raise work_mem so the bitmap fits; a more selective index also shrinks it |
Several of these rules sound alike. The capture below shows two pairs of them firing differently on the same plan.
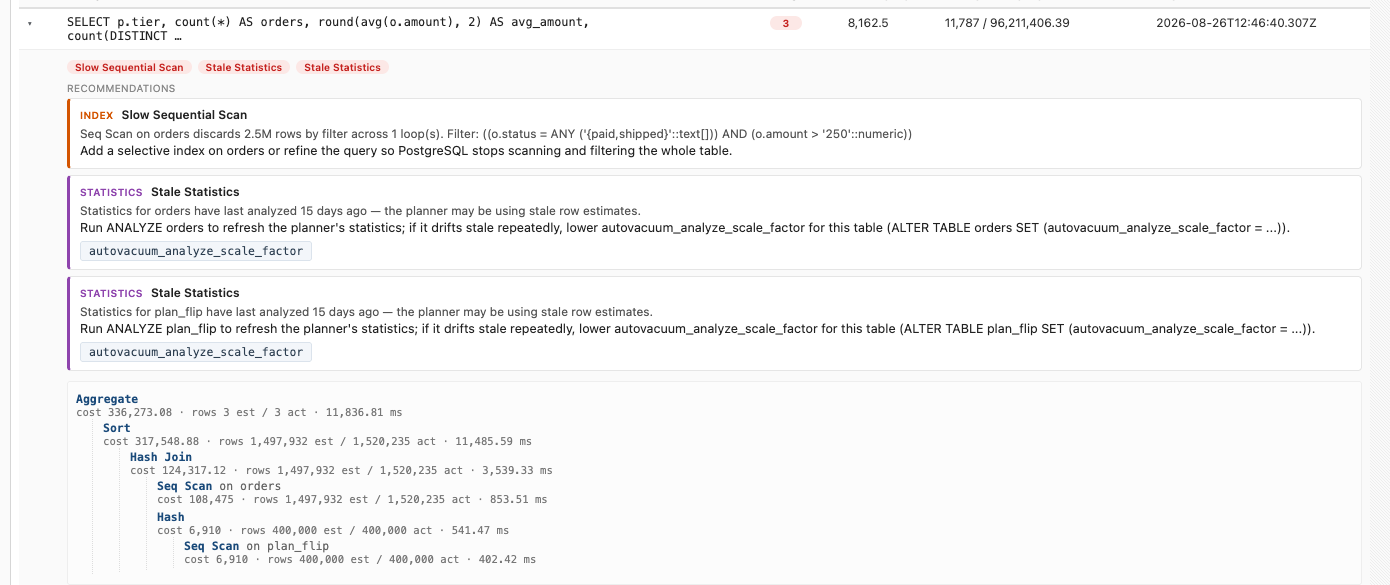
Slow Sequential Scan fired; Insufficient Index did not. The scan on orders throws away 2.5 million rows, which is plenty to trip Slow Sequential Scan. But it still returns about 1.5 million, and Insufficient Index is specifically about a scan that reads a lot and returns only a few. That is the case where an index lets PostgreSQL seek straight to the handful of rows it wants. A query that genuinely needs 1.5 million rows is a different problem, and the recommendation reflects that: add a selective index or refine the query.
Stale Statistics fired; Misestimate did not. Both tables were last analyzed fifteen days ago, so Stale Statistics raises its hand. But look at the plan tree: the planner estimated 1,497,932 rows from orders and got 1,520,235, within 1.5%. The statistics are old, and they are still right. Stale Statistics measures age; Misestimate measures accuracy. When only the first fires, running ANALYZE is cheap housekeeping rather than the fix for a slow query.
A single plan node can also trip more than one rule. A scan that is both unselective and large raises Insufficient Index and Slow Sequential Scan together, because they are two arguments for the same fix.
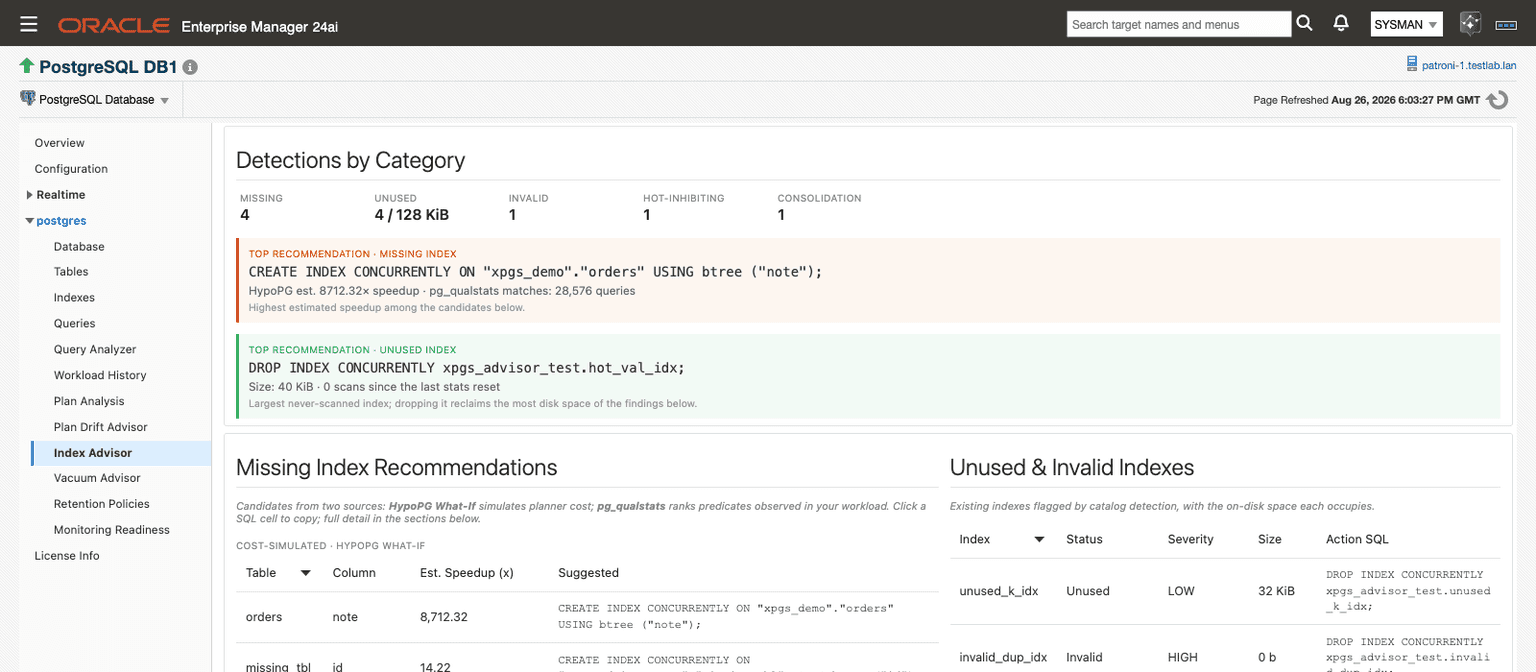
Every recommendation is a card you read, copy, and run in your own tooling. When an Insufficient Index finding is the highest-impact insight across every capture on the target, a banner above the list names it and offers an Open Index Advisor button, which lands on the ranked, ready-to-review index recommendations from part one.
Plan drift: when a query leaves its baseline
Plan Analysis tells you what is wrong with a plan. The Plan Drift Advisor answers a different question: is this query still running one of its baseline plans, and if not, when did it leave?
It keeps a set of accepted baselines per query and compares every new capture against them. Its entry point, Problematic Queries, lists only the queries whose most recent capture scored worse than OK.
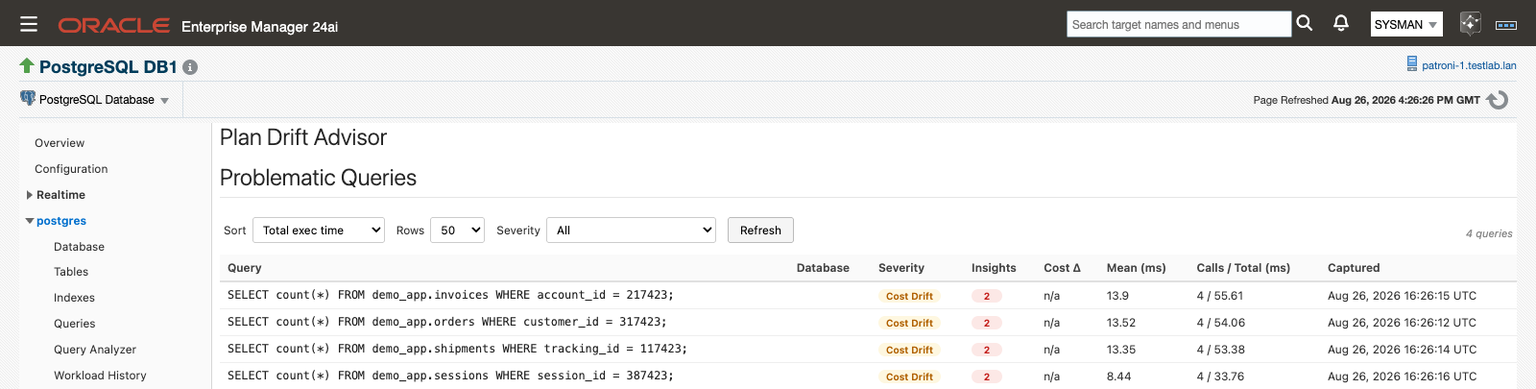
Look at the Cost Δ column: every row reads n/a, because none of these queries has an accepted baseline yet. They are on the list anyway. That is the first of the two checks at work.
The acute check compares each capture with the previous capture of the same query. It needs no baseline at all, so it catches a sudden regression on a query with no accepted baseline: a cost jump past a threshold, or a change of shape that also pushes cost past it. On its own it tops out at Cost Drift.
The baseline check applies once the query has an accepted baseline. If the running shape is in the accepted set, its cost is measured against the cheapest accepted plan and reported as Cost Drift when it strays too far. If the running shape is not in the accepted set, the query reads Plan Changed, unless you have switched off the structural-change alert, in which case that plan is judged on cost alone. Plan Changed is the alertable condition.
Follow the invoices query from that list. The acute check flagged it with no baseline in place. A DBA then accepted the earlier plan for that query as its baseline, labeled "Approved after review," and the comparison makes the regression unmistakable:

The baseline plan answered this count with an Index Only Scan at a cost of 8.45, in a tenth of a millisecond. The plan the query is running now does a parallel sequential scan of the whole table: cost 8,417.45, 55 milliseconds. That is a cost increase of 99,514.8% against the baseline. The highlighted nodes are the shape difference, and the shape difference is where the diagnosis starts: the planner is no longer using the index, and the next question is why. Since the running shape is outside the accepted set, this is exactly what the Plan Changed badge and the drift alert exist to report.
The comparison shows what changed. The Drift History panel above it shows when. It plots each capture's cost delta against the baseline alongside its mean execution time on a second axis, over a window you choose, so a cost change that left real execution time flat shows up as exactly that. Click any capture in the table beneath the chart and the Plan Comparison redraws against that capture instead of the newest one, which is how you find the first capture on the bad plan.
Two rules in the severity model are worth knowing because they run against intuition.
- Only cost increases count as drift. Both cost comparisons fire when cost rises. A plan that gets cheaper shows a negative delta on the page and raises no alert.
- Running a retired plan reports Plan Changed. If a query drifts back onto a baseline you have retired, that counts as drift, because the status reflects your accepted baseline set rather than what the database happens to be doing.
Baseline mode ships as Manual, so a plan becomes a baseline only when someone accepts it. When you accept a baseline, you can give it a label and a note; when you retire one, you give a reason. The label and the retirement reason appear in the page's Audit Trail, so write them for whoever manages these baselines next. Observed shapes still accumulate as candidates in the meantime, so the captures are already there when you decide to accept one.
Automatic promotion is available through the opt-in Auto mode. A candidate is promoted once it has been seen enough times over enough days, and only if its cost stays within a guard relative to the cheapest accepted plan. That guard is what stops a stable-but-worse plan from being promoted just by being consistent. Two limits keep the accepted set from growing forever: a size cap that retires the least recently seen baselines, and a staleness window that retires baselines not seen for a while. Pin exempts a baseline from both. Pin the plan you want running in production, and it survives every sweep.
The drift checks' two cost tolerances are deviation percentages: a band of 150% means the current plan must cost more than two and a half times the reference before it counts as drift. The Auto promotion guard is the opposite kind of number, a ratio of the accepted best, where 100 means "no worse than what we already accept."
Proving a fix before it ships
Once you know what changed, the next question is whether your fix works. That is the job of Fix Workbench: Test a Rewrite, at the bottom of the query's detail panels.
It is the one place in the plug-in that executes a statement to see its plan, and nothing happens until you click Run Explain. The workbench prefills the captured query text; you replace any bound-parameter placeholders such as $1 with representative real values, edit the SQL into the rewrite you want to test, and run it. It puts EXPLAIN (ANALYZE, FORMAT JSON) in front of what you type, so you enter the statement itself. The resulting plan tree renders right there, and you compare it against the current and baseline trees above.
Because EXPLAIN (ANALYZE, ...) genuinely runs the statement, the plug-in treats it with care, and so should you:
- It runs inside a transaction that is rolled back, so an
INSERT,UPDATE, orDELETEin the rewrite leaves no changes behind. - It is capped at 30 seconds. A rewrite that runs longer is canceled and reports a failure instead of a plan.
- It still takes locks and uses CPU and I/O while it runs. Rolled back is not the same as free. Use test data or off-peak timing for anything that could contend with production work.
- Nothing schedules it. There is no background use of the workbench anywhere.
Pick representative parameter values. A rewrite tested against an unusual value produces a plan you cannot learn from.
The one decision that is yours
Capture needs two things on the database side, and the plug-in handles them very differently on purpose.
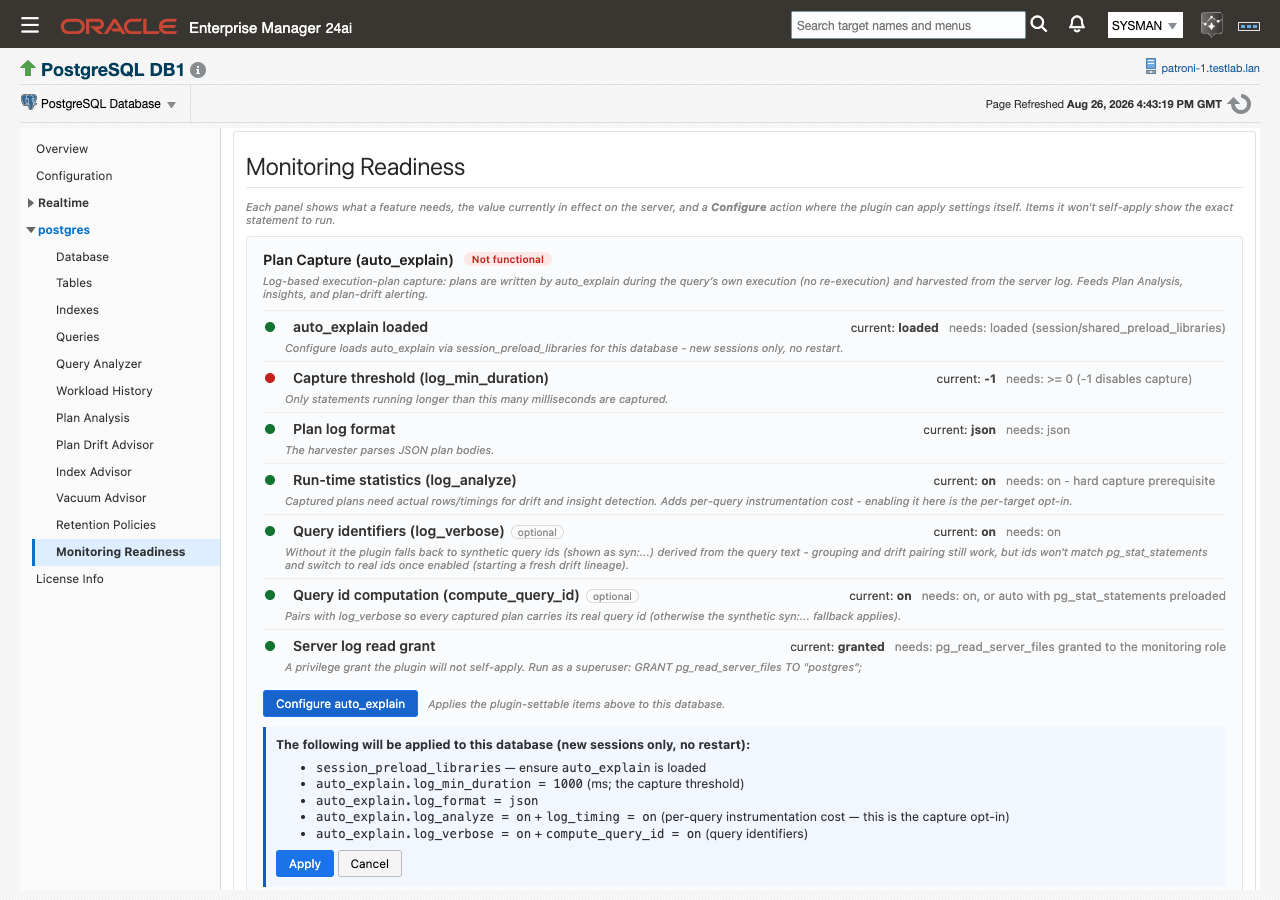
The auto_explain settings, the plug-in applies for you. The Monitoring Readiness page probes the target and shows each capture requirement beside the value live on the server now, as in the screenshot earlier in this post. Where they differ, a Configure auto_explain button previews exactly what it will apply before you confirm. It loads the module through session_preload_libraries, which takes effect for new sessions and needs no server restart. The one setting to understand before you click is auto_explain.log_analyze. It is what gives captured plans their actual rows and timings, which the insights and drift detection both depend on, and it adds per-query instrumentation cost. That is why turning it on is an explicit opt-in per target rather than a default.
The pg_read_server_files grant, the plug-in deliberately leaves to you. Reading the server log requires the monitoring role to hold PostgreSQL's pg_read_server_files role. The Readiness page shows the exact statement to run, and a superuser runs it through your own process:
GRANT pg_read_server_files TO "<monitoring role>";The server-side logging settings capture reads from are also yours: logging_collector = on, the stderr log destination, and a timestamp-first log_line_prefix starting with %m. The harvester does not parse csvlog or jsonlog.
In this release, that grant is needed only for these two pages. Everything else works without it, including the Index Advisor from part one.
When a plan becomes an alert
Both features publish their findings as standard Enterprise Manager metrics, with editable schedules, thresholds you can tune, alert history, and routing through whatever notification connector you already have bound.
| Metric | Collected | Default Warning | Clears when |
|---|---|---|---|
| Plan Insights | Every 15 minutes | A High-severity insight on a query's newest plan | The insight drops out of the next collection |
| Plan Drift | Every 15 minutes | A query running a plan shape outside its accepted set | The query is back on an accepted plan |
Cost Drift carries no default threshold. Ordinary variation in optimizer estimates would make it noisy across a fleet, so it stays advisory until you opt a particular query into it.
If the new plan turns out to be fine, accept it as a baseline. The alert clears at the next collection, because the query is now running an accepted baseline.
Does plan capture slow down my database?+
Capture itself adds nothing at query time, because auto_explain writes the plan during the statement's own execution and the plug-in reads it from the log afterward. The cost comes from auto_explain.log_analyze, which collects actual row counts and timings for every captured statement. The insights and drift detection both need that data, and it carries a per-query instrumentation cost, which is exactly why enabling it is an explicit per-target opt-in on the Monitoring Readiness page rather than something switched on for you. The capture threshold, log_min_duration, is the other lever: only statements running longer than it are captured at all.
Why does the plug-in need pg_read_server_files, and who grants it?+
Captured plans live in the PostgreSQL server log, and reading that log over a database connection requires the monitoring role to hold pg_read_server_files. The plug-in leaves that grant to you: it is a meaningful privilege, and granting it is a decision for whoever owns the database. The Monitoring Readiness page shows the exact statement for a superuser to run through your own process. In this release, the grant is needed only for Plan Analysis and the Plan Drift Advisor; every other page works without it.
Do I need to restart PostgreSQL to turn on plan capture?+
Not for the plug-in's part. The Configure auto_explain action loads the module through session_preload_libraries, which applies to new sessions and needs no server restart, and it previews exactly what it will change before you confirm. The server-side logging settings capture reads from, such as logging_collector, the stderr destination, and a timestamp-first log_line_prefix, are yours to set through your normal change process. If they are already in place, turning capture on is a click and a confirmation.
Does the plug-in run my query to get a plan?+
Not to capture one. Capture is entirely passive: plans come from the server log, written while the query ran for real. The only place the plug-in executes a statement to see its plan is the Fix Workbench, and only when you click Run Explain on SQL you have typed or edited. That run happens inside a transaction that is rolled back and is capped at 30 seconds, and nothing schedules it in the background.
What if my captured plans don't have a query id?+
They still work. When a plan arrives without a real query id, usually because compute_query_id or auto_explain.log_verbose is off, the plug-in computes a synthetic id from the normalized query text and shows it with a syn: prefix. Grouping, plan history, drift detection, and baselines all keep working on synthetic ids. If you turn the real ids on later, the affected statements move to their new ids and start a fresh history from that point, so expect their drift history to restart.
A drift alert fired, but the new plan looks fine. What should I do?+
Accept it. Open the query on the Plan Drift Advisor, check the plan comparison and the insight cards, and if the new plan is genuinely acceptable, accept it as a baseline in Baseline Management. The drift metric reports the state of the query at each collection, so once the running shape is in the accepted set the alert clears on its own at the next collection. The label you give it appears in the page's Audit Trail.
Should I switch baseline mode to Auto?+
Start with Manual, which is the default, at least until the queries that matter most have accepted baselines. Manual means a person accepts every baseline. Auto is useful across a large fleet where accepting every stable plan by hand is not realistic, and it is guarded: a candidate is promoted only after it has been seen enough times over enough days and only if its cost stays within the cost guard of the best plan you already accept. Whichever mode you use, pin the plans you want running in production. The set size cap and the staleness sweep both skip pinned baselines.
Where this fits
Plan Analysis and the Plan Drift Advisor are two of the five advisors that arrived in the August 2026 release, 24.1.1.0.0 for Enterprise Manager 24ai and 13.5.15.0.0 for Enterprise Manager 13.5. The current release, 24.1.2.0.0 and 13.5.16.0.0, keeps them and adds fixes.
This is the second of four posts on those advisory features. Part one covered the Index Advisor and the HypoPG and pg_qualstats extensions behind it. The next two cover the Vacuum Advisor and the xmin horizon, on why autovacuum falls behind on a table and what is pinning the transaction horizon, and Workload History, on replaying weeks of statement statistics from a history store that lives on the agent rather than in your Enterprise Manager repository.
If you are upgrading, start at Monitoring Readiness on each target. It shows, feature by feature, what that target is still missing, including whether plan capture is ready.
We are demonstrating all five advisors live on September 23, 2026. Details and registration.
- Plan Analysis reference → docs.integrationplumbers.io/postgresql/plan-analysis.html
- Plan Drift Advisor reference → docs.integrationplumbers.io/postgresql/plan-drift-advisor.html
- Plan capture prerequisites → docs.integrationplumbers.io/postgresql/prerequisites.html#auto-explain
- The plug-in → integrationplumbers.io/postgresql-plugin