Some slowdowns arrive as a spike that someone notices within the hour. Others build over weeks: a statement that took 40 milliseconds in September takes 90 by November, a little more each day, and no single day looks unusual. The second kind is the harder one to diagnose, because the evidence is the change over time, and that is the part most tools do not keep.
PostgreSQL's pg_stat_statements extension already records per-statement execution statistics, which is why the query-history post in our MySQL, SQL Server, and DB2 series left PostgreSQL out. Its counters are cumulative, though. They add up everything since the extension was last reset, so they show which statements are expensive overall, but not which ones got more expensive this week, or since a release, or compared with the same week last month.
Workload History adds the time axis. The plug-in snapshots pg_stat_statements on every collection, stores the snapshots in a history store on the Enterprise Manager agent, and replays them over a window you choose. The same store holds the plug-in's other long-window history, and the Retention Policies page sets how long each kind is kept.
This is the fourth of four posts on the advisory features in the PostgreSQL Plug-in for Oracle Enterprise Manager. Part one covered the Index Advisor, part two covered Plan Analysis and the Plan Drift Advisor, and part three covered the Vacuum Advisor and the xmin horizon.
From cumulative counters to a timeline
On each collection, the plug-in reads pg_stat_statements and writes the snapshot to the target's history store on the agent. Workload History computes everything it shows, including the per-window deltas, means, and cache-hit ratios, from those stored snapshots in the plug-in's agent-side code. The page reads the history store only and does not query the monitored database.
Two prerequisites follow from that. pg_stat_statements has to be installed and enabled on the target, or no per-statement history accumulates. And because the page is backed by an Enterprise Manager job that reads the store on the agent host, Preferred Credentials have to be set for the target's host.
History starts accumulating when the target is first monitored. A new target reads "0 days" of history depth and grows toward its retention window, so give it a day before reading a trend.
The Workload History page
The page opens on the last 24 hours in your browser's local time. From and To pickers set the window, and leaving both blank scopes the page to all the history the store holds. The pickers are in your browser's time zone, and the plug-in converts them to UTC for the store query, because the store keeps its timestamps in UTC. A window wider than the retained history shows the data that exists.
Like the plug-in's other database-scoped pages, Workload History follows the database selected in the target's navigation tree. Select a different database in the tree and the page repaints for it.
Three bands follow, and the window applies to all of them.
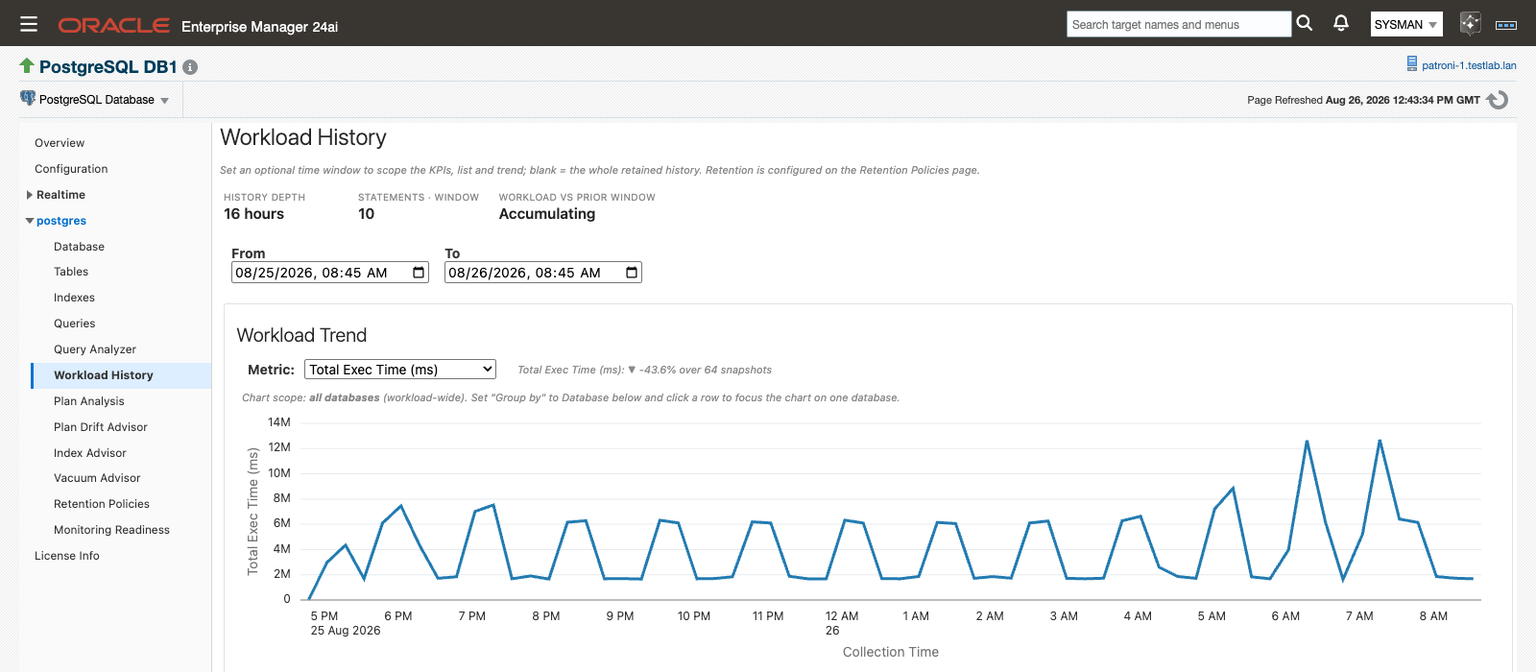
The KPI band reports History depth, how far back the oldest snapshot in the target's store goes; Statements · window, the number of distinct statements in the selected database with activity in the window; and Workload vs prior window, that database's total execution time in the window against the equal-length window immediately before it, as an up, down, or flat arrow with a percentage.
The Workload Trend chart plots one metric per collection snapshot: Total Exec Time, Mean Exec Time, Calls, or Cache Hit Ratio. Total execution time and calls are summed across statements for each snapshot; mean execution time and cache-hit ratio are averaged. A note beside the metric selector gives the first-versus-last movement across the window, for example "▲ +12.3% over 40 snapshots".
Workload Detail lists the statements active in the window. It sorts by total execution time, calls, mean execution time, rows returned, or I/O share, and shows 25, 50, 100, or 250 rows, with 50 as the default. The row limit applies across the target before the page narrows the list to the selected database, so on a target with several busy databases the list can show fewer rows than the limit. Each statement row shows:
| Column | What it shows |
|---|---|
| Query and Queryid | The statement text and its pg_stat_statements query id |
| Database | The database the statement ran in |
| Total Exec (ms), Calls, Rows | Totals for the window |
| Calls/hr | Calls divided by the window length, so windows of different lengths compare directly |
| Mean (ms) | Mean execution time in the window |
| Cache Hit | Share of block reads served from shared buffers |
| I/O Share | The statement's share of the window's shared-buffer block accesses |
| Trend | First-versus-last movement in total execution time across the window |
From a trend to one statement
The page is laid out to work from the shape of the chart down to the statement behind it:
- Set From and To around the period in question. Changing either one re-scopes the KPIs, the chart, and the list.
- Choose the metric that shows the problem. Total Exec Time is the usual starting point, because it moves with both call volume and per-call cost.
- In Workload Detail, sort by the same metric and look for statements whose Trend matches the chart.
- Click the statement's row. The Statement Drill-down panel opens above the list and plots that statement's own history for the same metric and window.
- Widen or narrow the window and watch the drill-down redraw. A rise that holds across a wider window is a regression; one that flattens out was a single slow run.
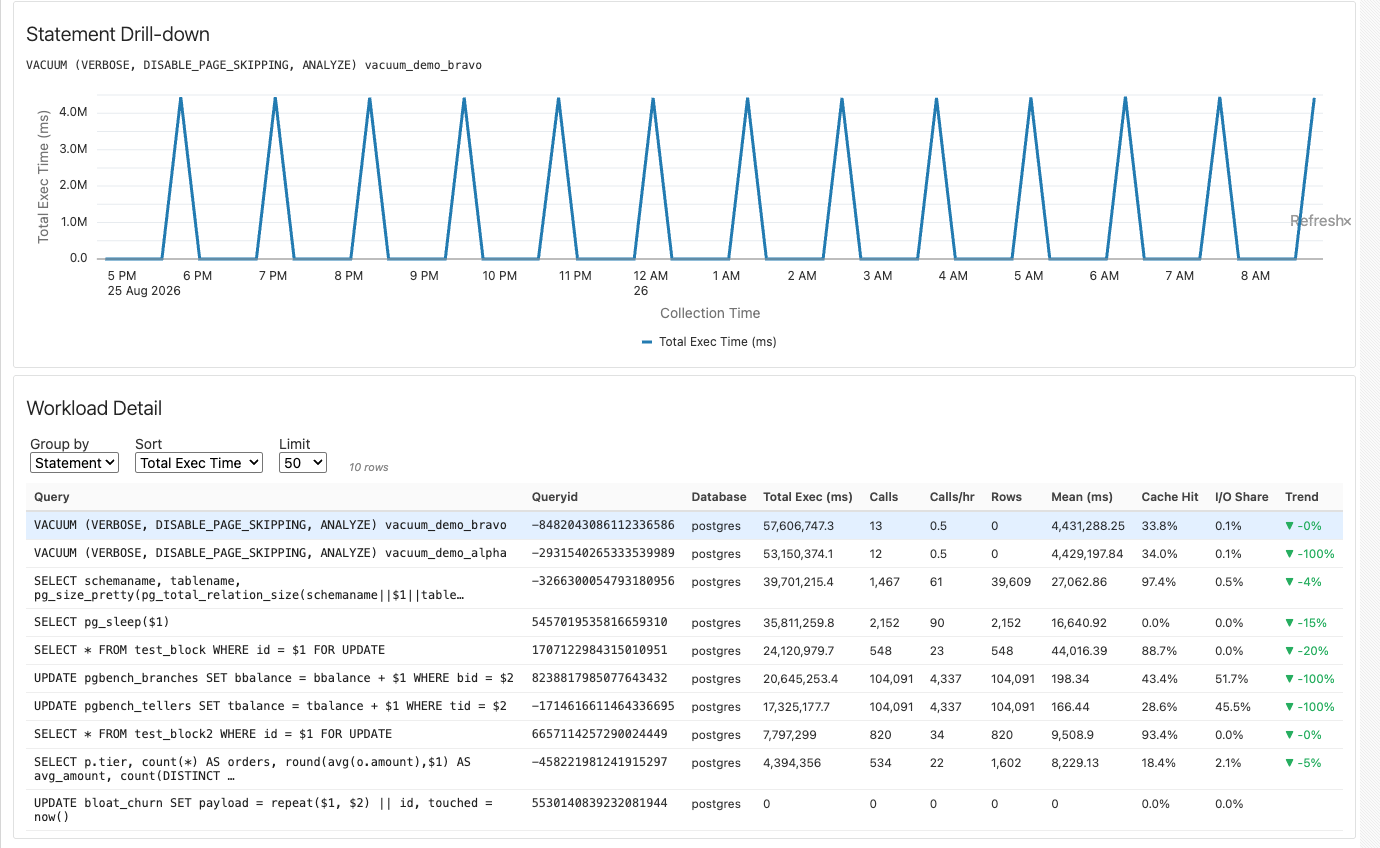
When the drill-down has nothing to plot, it says there is no per-snapshot history for the statement in the current window, which usually means the statement ran outside the window.
Reading the numbers
The page shows a placeholder where it cannot support a number. Workload vs prior window reads "n/a" when no explicit window is set, because there is no prior period to compare against; "Accumulating" when the prior window holds no snapshots yet; and "—" when the prior window has snapshots but no recorded execution time. The movement note shows "n/a" without an arrow when a percentage cannot be computed, and the chart says so when a window holds no snapshots or only one.
The first-versus-last comparisons depend on where the window starts and ends. The first snapshot inside a window has no predecessor inside it, so movement is measured from the first non-zero value. A statement that runs once an hour can show −100% in Trend because the last snapshot in the window happened to record no activity for it. And moving a window by a few minutes can move the page-wide note a long way when the workload has regular peaks: the two screenshots in this post were taken four minutes apart, and the note reads −43.6% in one and +103.9% in the other. The drill-down shows the actual shape, so open it before acting on a single percentage.
What the statements were waiting on
Workload History shows which statements took more time. Wait-event sampling shows what that time was spent waiting on. It uses the pg_wait_sampling extension and appears as a Wait Events chart on the Query Analyzer page.
The extension is installed through your own platform packaging, and the plug-in detects it rather than installing it. It has to be loaded through shared_preload_libraries, which requires a restart, and it attributes samples to individual queries only when its own pg_wait_sampling.profile_queries setting is all or top. The Wait Events Sampled metric enables itself on targets where the extension is present. It collects every 15 minutes and has no default thresholds; it feeds the chart and the history store.
In Query Analyzer, select a statement and choose a time range: the last day, week, or month, or a custom range. The chart stacks wait-event sample counts over time for that statement, grouped by event, in about 48 buckets and no finer than the 15-minute collection interval. Quiet periods appear as zeros rather than gaps, so a flat stretch means nothing waited.
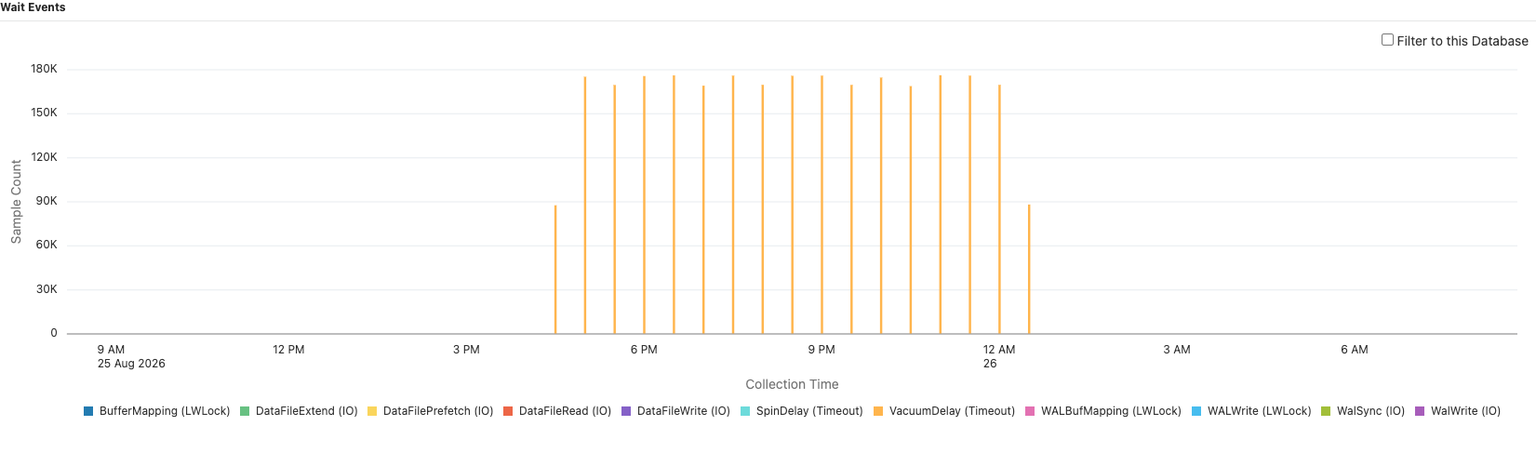
The range decides which level of history the chart reads. Seven days or less reads the raw 15-minute rows, and the Filter to this Database option is available. Longer ranges read hourly rollups up to 31 days and daily rollups beyond that; the rollups do not carry per-database detail, so the database filter is disabled for them.
Wait time on this chart is an estimate: the sample count multiplied by the extension's sampling period. The plug-in reads the live pg_wait_sampling.profile_period from the server at each collection, and uses the extension's 10 ms default where it has not captured one. Wait history can be high-volume, and the PostgreSQL - Set Wait History Retention Threshold job sets a minimum daily wait time a query and wait-event combination must reach for its daily row to be kept. The default is 0, which keeps every combination that waited at all.
Where the history lives
The history store is a SQLite database on the agent host, one per PostgreSQL database target, at <agent state directory>/ip_plugin/xpgs/data/<target name>_collections.sqlite3. It creates itself at the first collection that keeps history and updates its own schema on later releases. The plug-in sets its permissions to owner read and write with group read on the database file, and 750 on its directory. Nothing listens on a network port for it, and it holds no Enterprise Manager credentials. Aggregates and alert-carrying metrics go to the Enterprise Manager repository as usual; the store holds the granular detail underneath them.
Besides workload snapshots, the store holds captured execution plans, advisor findings, and five infrastructure tiers: table, database, background-writer, index, and sampled wait-event history. The infrastructure tiers stage a full-resolution row on every collection, and once a day a condense step turns each completed UTC day into one row per object. That daily row keeps what matters for trends, such as the day's peak dead-tuple count for a table and its peak transaction-ID age for a database. Reads that include the current day merge in that day's staged rows, so today's figures are included before the nightly condense runs.
Monitoring Readiness includes a Historical Store check that reports the store's presence and size.
Retention Policies
The Retention Policies page sets how long each kind of history is kept. It lists twelve history types, each with a maximum retention, which the daily trim enforces, and a protected minimum, which size-based cleanup leaves in place.
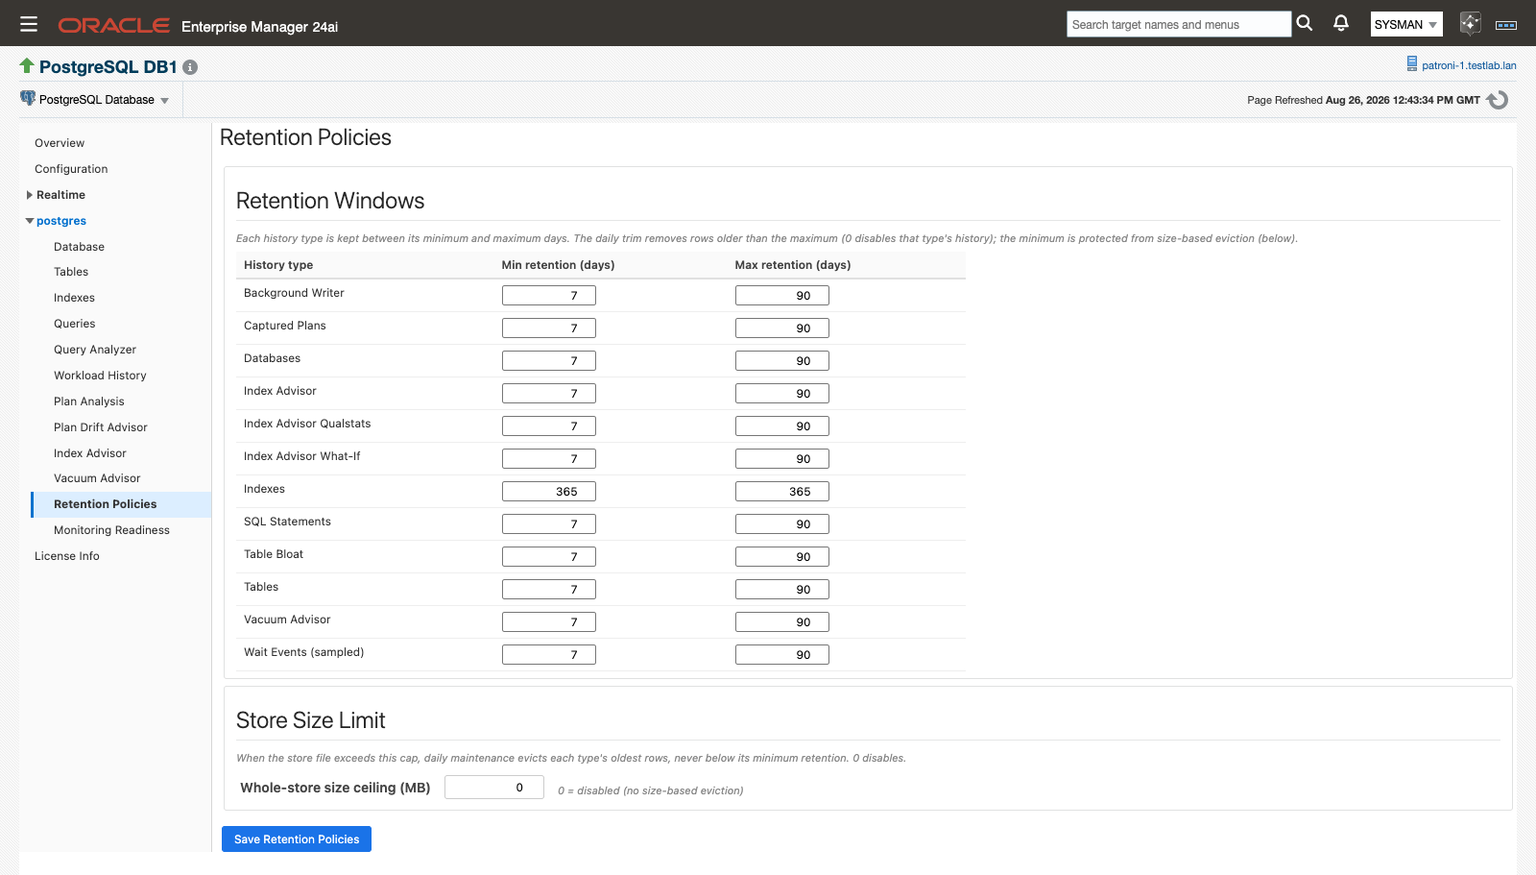
Every type ships at a 90-day maximum and a 7-day protected minimum, except Indexes, the long-term archive, at 365 days for both. Changes apply at the next daily trim. Setting a type's maximum to 0 stops keeping that type's local history and removes its existing rows at the next trim, without affecting Enterprise Manager collections or alerts. Captured Plans is the exception: for it, 0 means no age limit.
Two ceilings cap the store's size. The captured-plan archive is capped at 100 MB by default and removes the oldest plans first, keeping the plans behind pinned baselines. The whole-store ceiling ships disabled; when it is set and the file grows past it, daily maintenance removes the oldest rows of each type down to about 85% of the ceiling, stopping at each type's protected minimum. Daily maintenance also compacts the file when at least 32 MB and 25% of it is reclaimable, and the PostgreSQL - Reclaim Collection Store Disk Space job compacts it on demand.
Every setting on the page is also available as an Enterprise Manager job, for scripting retention across a fleet with emcli. These windows govern the agent-local store only; metric retention in the Enterprise Manager repository follows the standard Enterprise Manager settings.
The collection throttle
The collection throttle lets the plug-in reduce its own load when the agent host is busy. It is off by default. Two target properties, a CPU threshold and a memory threshold, each in percent, turn it on. While the agent host's usage is at or above either threshold, the plug-in skips its heavier scheduled collections for that cycle. Collection schedules are unchanged, and collections resume when usage drops.
The CPU reading is the 1-minute load average divided by the core count, and memory usage comes from /proc/meminfo, so the throttle applies to agents on Linux. On other hosts, the plug-in collects as normal. The thresholds are meant for agents running on the database host; on a remote agent the readings describe the agent's host rather than the database's.

While the throttle is active, an amber banner at the top of each plug-in page gives the reason, and it clears itself when usage drops. The Collection Throttle metric records each throttled period every five minutes, which explains gaps in a chart afterwards. Collections that keep the target monitored and user actions keep running throughout, including availability checks, real-time page loads, user-submitted jobs, license collection, and the daily retention trim. A collection that is skipped is not evaluated against its thresholds, so alerts raised before a throttled period stay open through it.
Does Workload History add load to the monitored database?+
The page itself does not query the monitored database: it reads the agent-local history store through an Enterprise Manager job. The history comes from the plug-in's regular scheduled collection of pg_stat_statements, the same collection that runs whether or not anyone opens the page.
How far back can I look?+
As far back as the store holds. SQL statement history is kept for 90 days by default, and you can raise or lower that on the Retention Policies page. A new target starts at zero and builds up from its first collection, and the History depth KPI shows how far back the current data goes.
Does the history store grow the Enterprise Manager repository?+
No. The granular history lives in a SQLite file on the agent host, one per target, governed by the Retention Policies page. The repository receives the plug-in's aggregates and alert-carrying metrics as it does for any plug-in, and repository retention follows the standard Enterprise Manager settings.
Do I need pg_wait_sampling?+
Only for the Wait Events chart on Query Analyzer. Workload History needs pg_stat_statements alone. pg_wait_sampling has to be loaded through shared_preload_libraries, which requires a restart, and it is not included in most PostgreSQL distributions, so plan its installation through your normal packaging and maintenance process. The Monitoring Readiness page reports whether it is in place.
Why does a statement show −100% in the Trend column?+
Trend compares the statement's activity in the first and last snapshots of the window. A statement that runs infrequently can have no activity in the last snapshot, which reads as −100% even when it ran normally earlier in the window. Click the row to open the drill-down and see the statement's actual history.
Should I turn on the collection throttle?+
If your agent runs on a database host where CPU or memory is sometimes constrained, it gives the plug-in a way to step back during those periods. It applies to agents on Linux and is off until you set a threshold. The trade-off is gaps in the heavier metrics while the throttle is active; the banner and the Collection Throttle metric record when and why.
Where this fits
Workload History is one of five advisors that arrived in the August 2026 release, 24.1.1.0.0 for Enterprise Manager 24ai and 13.5.15.0.0 for Enterprise Manager 13.5. The current release, 24.1.3.0.0 and 13.5.17.0.0, keeps it and adds fixes: Workload History follows the database selected in the navigation tree, and the plug-in now keeps the statements with the most activity in each collection interval rather than the most activity since the statistics were last reset.
This is the fourth of four posts on those advisory features. Part one covered the Index Advisor and the HypoPG and pg_qualstats extensions behind it, part two covered Plan Analysis and the Plan Drift Advisor, and part three covered the Vacuum Advisor and the xmin horizon. For MySQL, SQL Server, and DB2, Was That Query Always This Slow? covers the same question of query history over time.
- Workload History reference → docs.integrationplumbers.io/postgresql/workload-history.html
- History store and retention → docs.integrationplumbers.io/postgresql/history-store-and-retention.html
- Installing pg_stat_statements → docs.integrationplumbers.io/postgresql/prerequisites.html#pg-stat-statements
- The plug-in → integrationplumbers.io/postgresql-plugin
See it in action
If you missed our September 23 webinar, What's New with the PostgreSQL Plug-in for Oracle Enterprise Manager, the recording walks through all five advisors running live in Enterprise Manager 24ai. The Workload History demo starts at 17:28.
To see the plug-in in person, visit the Integration Plumbers team at Booth #7024 at Oracle AI World, October 25–28.