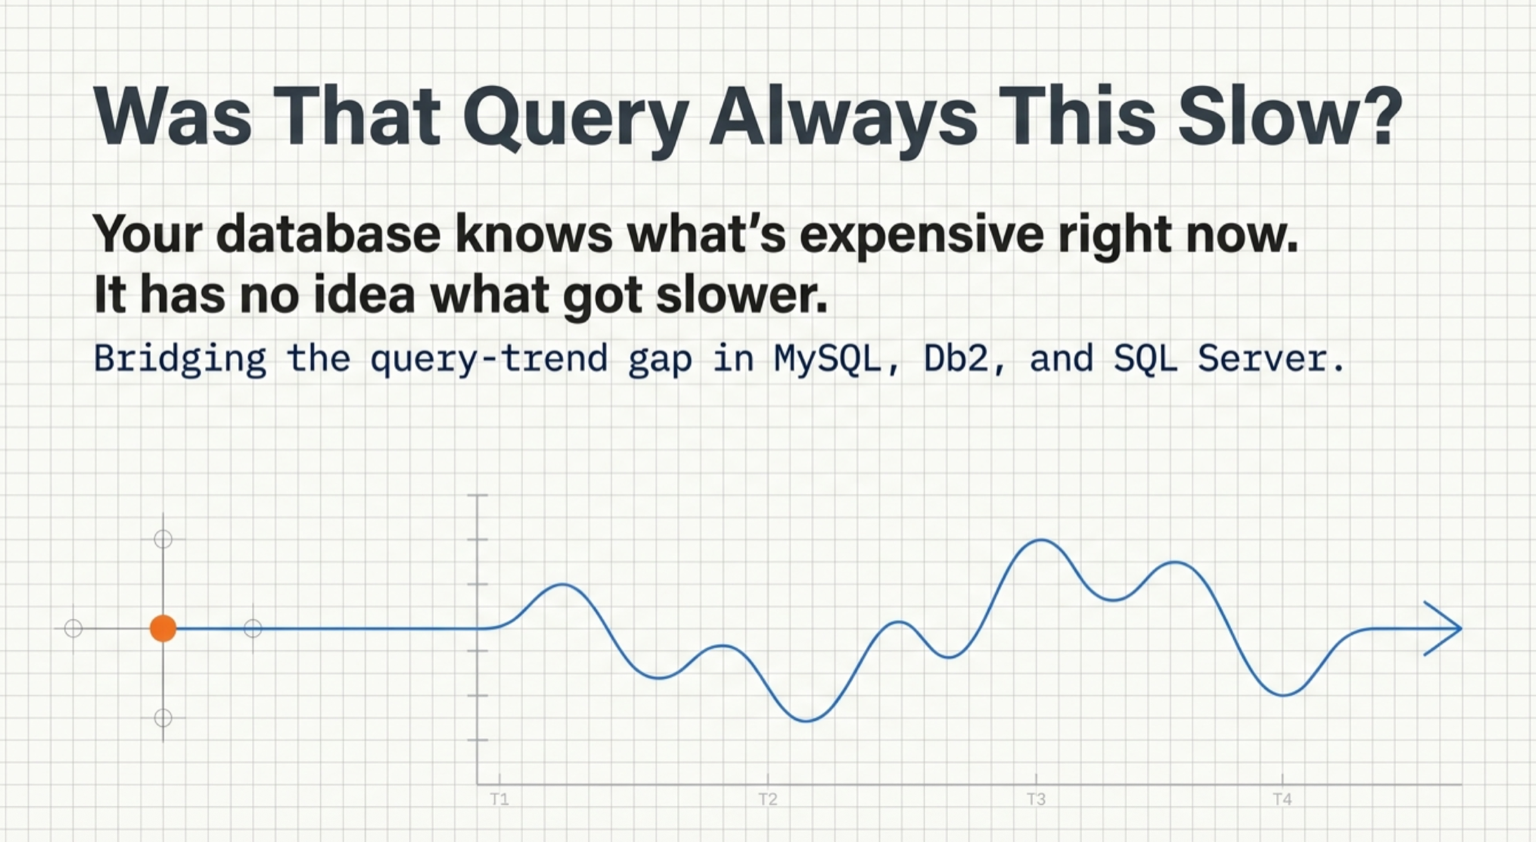
A query is slow this morning. Someone asks the obvious next question: has it always been like that, or did something change? You pull up the live stats, and there it is, expensive and near the top of the list. But that view only tells you it's slow now. Whether it was this slow last Tuesday, or quietly doubled after Thursday's deploy, isn't in front of you. So you go grep an old slow-log file, line up deploy timestamps by hand, or just guess.
Here's the gap, up front. Your database keeps a running tally of how each query performs, but not its history. The number it shows you is a cumulative total since the last restart, or a figure that lives in a cache and gets evicted as the cache fills. There's no time axis, so "is this query regressing, and when did it start?" has no native answer. For MySQL and Db2, the Integration Plumbers plug-ins close that gap the unglamorous way: they snapshot the per-query stats into the Oracle Enterprise Manager repository on a schedule, so every statement gets a trend line you can read over any window. SQL Server is the interesting exception, and the exception is the best evidence the whole idea matters.
This post has three parts: why "slow now" isn't "getting slower," the per-query record each database keeps and what it forgets, and why the repository is where the trend belongs.
1. "Slow now" isn't "getting slower"
The native per-query views are good at one question: of everything that has run, what's expensive? What they don't carry is a time dimension. They hand you a single accumulated number per query, not a series of points you can draw a line through. That's fine for "what should I look at today" and useless for "what changed."
And "what changed" is the question that actually shows up in incidents. A query that's slow and always has been is a tuning task you can schedule. A query that was fine until 2 p.m. Thursday is an incident with a cause you can still find. Telling those two apart needs history, and history is what the live view doesn't keep. So the investigation falls back to slow-log files and deploy-log archaeology, days after the evidence you wanted has already rolled off.
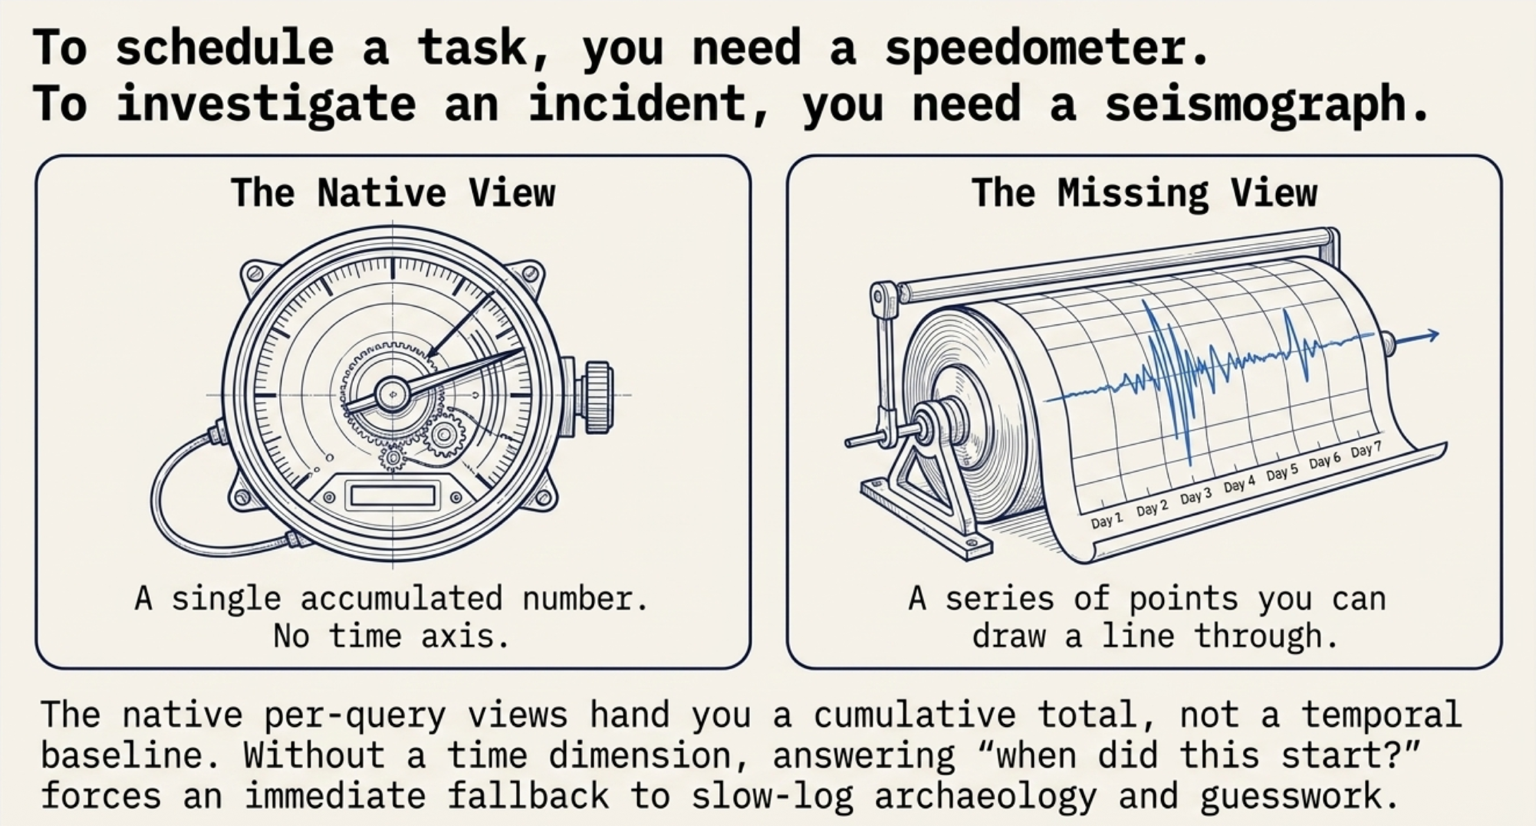
There's a subtler trap underneath this, and it's the reason you can't fix the problem just by charting what's already there. These counters are cumulative. Bind one straight to a graph and you get a line that only ever climbs, which tells you nothing about load in any particular hour. To get a useful trend you have to store consecutive readings and subtract them, and then deal with every way that subtraction can lie to you. More on that in part 3, because it turns out to be most of the work.
2. The record each database keeps, and what it forgets
Each of these databases already computes rich per-query numbers. The catch is what happens to them over time.
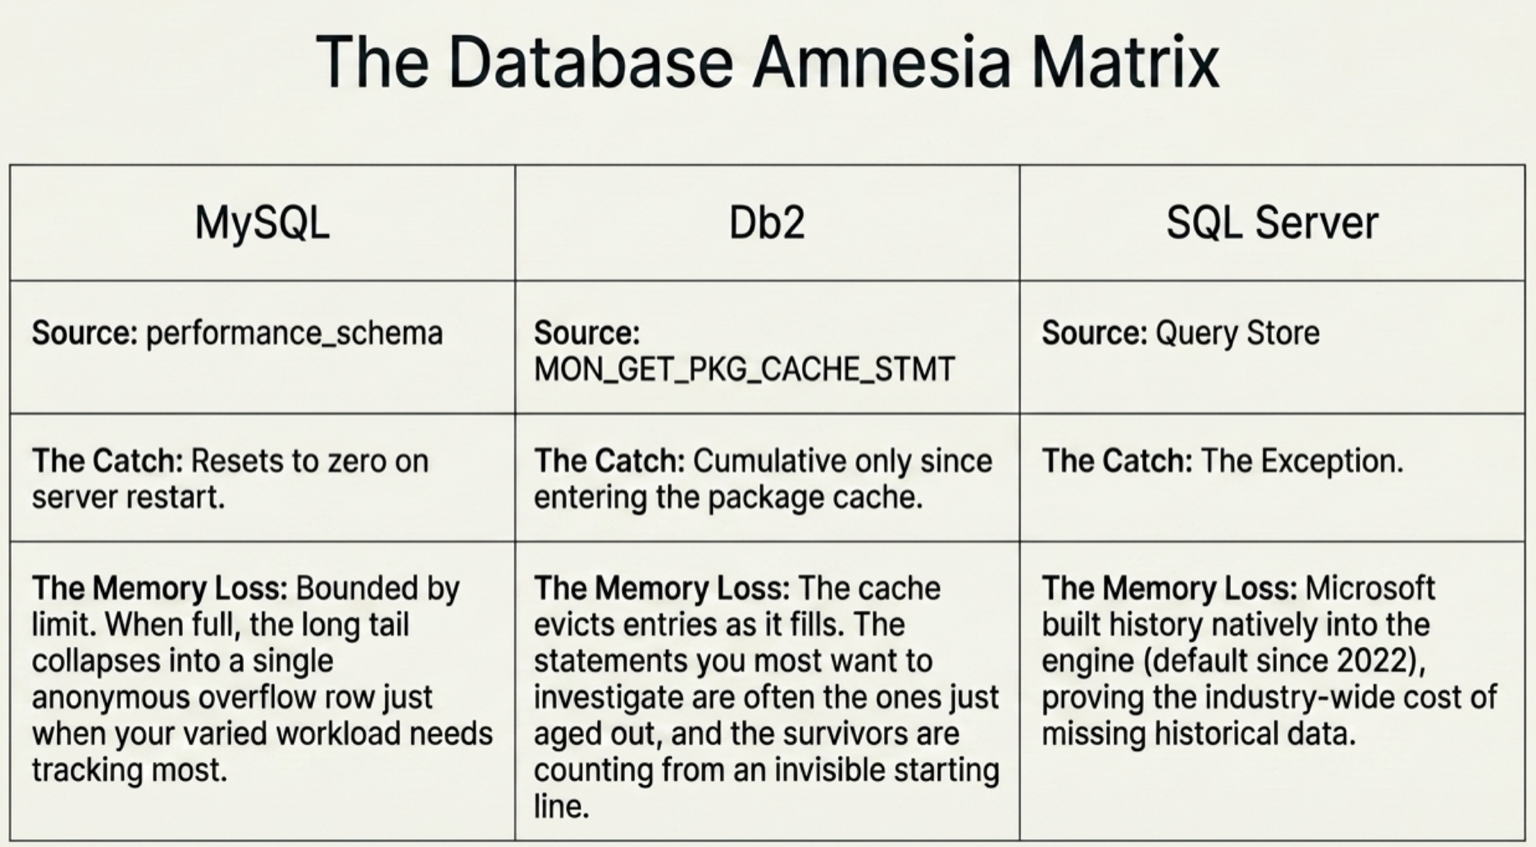
MySQL. performance_schema aggregates every normalized statement into a digest summary with the good stuff: execution counts, total and average latency, lock time, rows examined versus rows sent, and how often a statement ran without using an index. It's genuinely useful, and it's a running total with no history. Reset it, or restart the server, and it starts over from zero. The table is also bounded in size. Once you exceed performance_schema_digests_size, everything past the limit collapses into a single anonymous overflow row with a null digest, so the long tail stops being individually attributable exactly when your workload is most varied.
Db2. On Db2 for Linux, UNIX and Windows, MON_GET_PKG_CACHE_STMT gives you the same shape of per-statement metrics from the package cache: executions, activity time, CPU time, lock wait time, rows read. Same catch, sharper edge. Those counters are cumulative since the statement entered the cache rather than since the instance started, and the package cache evicts entries as it fills. So the statements you most want to look back on are often the ones already aged out, and the ones still there are counting from a starting line you didn't choose and can't see.
SQL Server. Here's the exception, and it's the one that proves the point. Microsoft built query history into the engine. Query Store retains query text, plans, and runtime statistics over a configurable window, and it's on by default for new databases as of SQL Server 2022. When a database vendor ships this as an engine feature and turns it on for everybody, that's a strong statement about what the missing history costs.
It also shaped the order we built in. MySQL and Db2 had no equivalent, so those are the two that got the repository-side trend first. On SQL Server today the plug-in's Queries page shows live plan-cache statistics, top statements by CPU and by execution count out of sys.dm_exec_query_stats, plus a rollup per execution plan. Surfacing Query Store itself, and the plan-regression analysis that comes with it, is a tracked roadmap item rather than something in the beta. Worth saying plainly: if you're on SQL Server 2022 or later, that history is accumulating in your database right now whether or not anything is reading it yet. If you're on something older, turning Query Store on is worth doing today no matter what ends up monitoring it.
3. Why the Oracle Enterprise Manager repository is where the trend belongs
The fix isn't clever. It's having somewhere to keep the numbers over time. The MySQL and Db2 plug-ins take periodic delta snapshots of the per-query stats into the Enterprise Manager repository, so each statement gets a trend you can read over any window you choose. Each one is tracked under a short stable key rather than under its text, which never gets persisted. MySQL snapshots every five minutes and keeps the top 25 statements per collection, keyed by the performance_schema digest hash. Db2 snapshots every fifteen minutes and keeps the top 200, keyed by a hash the agent computes from the statement text and then discards the text. What you get out of it:
- Top-N over a real window. Rank by latency, execution count, lock time, or rows read over windows running from real time out to the last month, instead of "everything since the server last restarted."
- Regression detection. This statement's average latency tripled on Thursday afternoon, with the line that shows it and the timestamp to line up against your deploy log.
- In one place. Next to the host, replication, and backup metrics, in the console you already run the estate from.
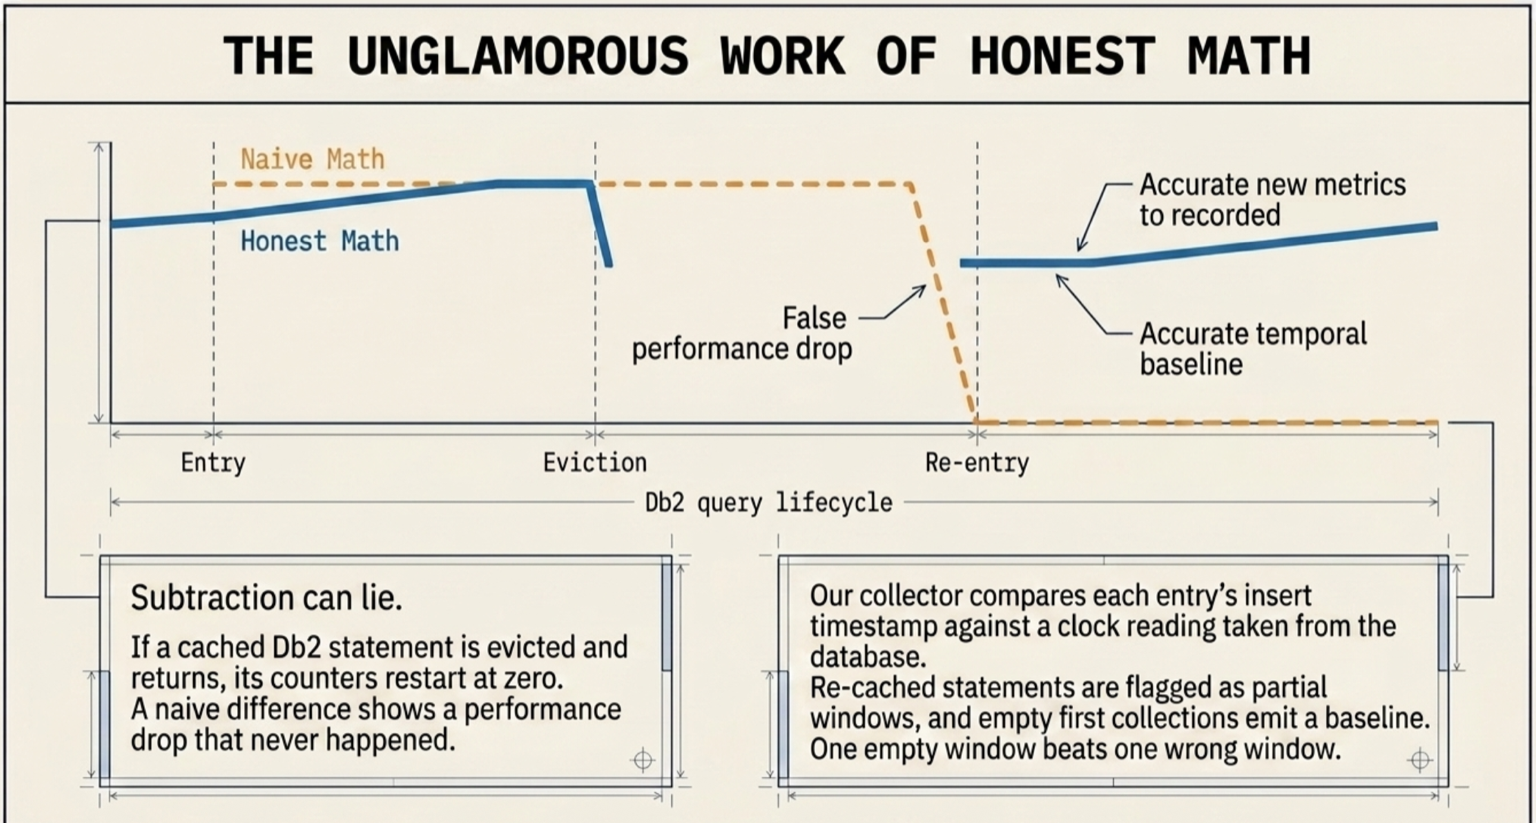
The unglamorous part is making the subtraction honest, and it's worth a paragraph because it's where this kind of feature usually goes wrong. Db2's collector is a good example. If a cached statement gets evicted and comes back, its counters restart at zero, and a naive difference would show a drop that never happened. If a busy database holds more statements than the collector samples, one can fall below the cut for a single cycle and reappear, and reading "absent last time" as "brand new" would report hours of accumulated work as one fifteen-minute window: a spike for a statement that never got busier. So the collector compares each entry's insert timestamp against a clock reading taken with the previous snapshot, both from the database rather than the agent so there's no skew to argue about, and it flags a re-cached statement as a partial window instead of quietly under-reporting it. On the very first collection it emits nothing at all and just records the baseline, because one empty window beats one wrong window.
What you get is numeric trend history keyed to each statement: how a given query's numbers move over time. What you don't get, in this release, is a searchable archive of full statement text and execution plans across history. Keeping every query's text and plan over time is a heavier and different storage problem, and it's the next step on the roadmap, built on the same purpose-built store the PostgreSQL plug-in is pioneering. There's also a real cap: the trend view can only aggregate the statements the collector kept per cycle, so the deep tail isn't in there. We'd rather say so than let you find out from a chart. For the question this post is about, "is this query regressing, and when did it start," the answer is a numeric trend, and that's what's arriving now.
Wrapping up
Your database is good at telling you what's slow this second and oddly bad at telling you what changed. The metrics to answer "did this regress" already exist. They just need somewhere to live over time, and something careful enough to subtract them correctly. That, in two sentences, is the feature.
For whoever's on call, it turns a familiar shrug into a straight answer. "Has this query always been like this?" stops being a slow-log expedition and becomes a line on a graph with a date on it. And for the SQL Server people reading this: you may already have the history and not know it. Go check whether Query Store is on.
We covered why "slow now" isn't "getting slower," the per-query record MySQL, SQL Server, and Db2 each keep and what each forgets, and why the trend belongs in the Oracle Enterprise Manager repository.
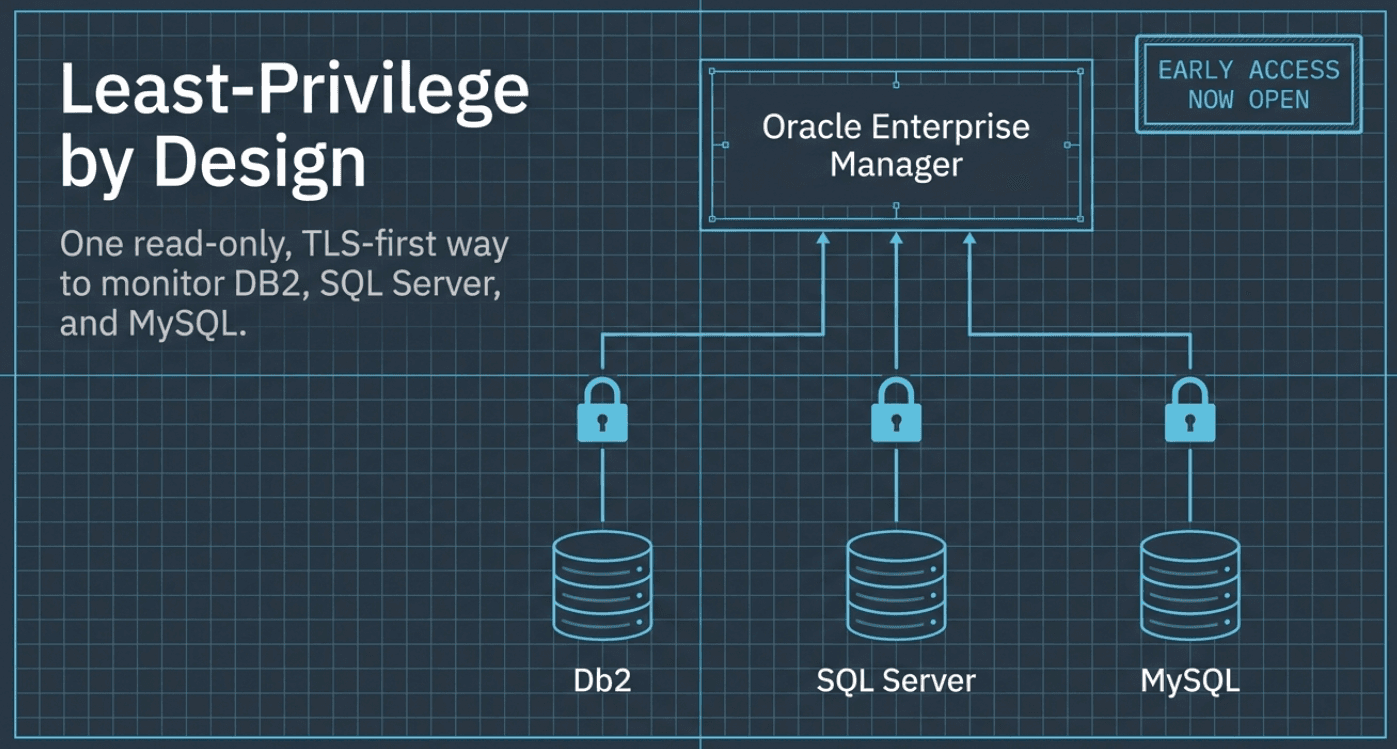
This is the seventh post in a series on the blind spots your estate monitoring leaves across MySQL, SQL Server, and DB2, and it closes the set. The earlier six were The Backup You Can't See, on whether last night's backup actually succeeded; The DR-Readiness Gap, on whether a "synchronized" cluster could really fail over without losing data; The Clock Ran Out on SQL Server 2016, on monitoring through an end-of-support migration; After MEM, on continuity for MySQL monitoring; No Cliff, No Drama, on monitoring DB2 11.5 and 12.1 and the new ground ahead; and Least-Privilege by Design, on the read-only, TLS-first posture all three plug-ins share. Seven posts on the gaps we kept finding between what a database knows about itself and what its monitoring can actually tell you.
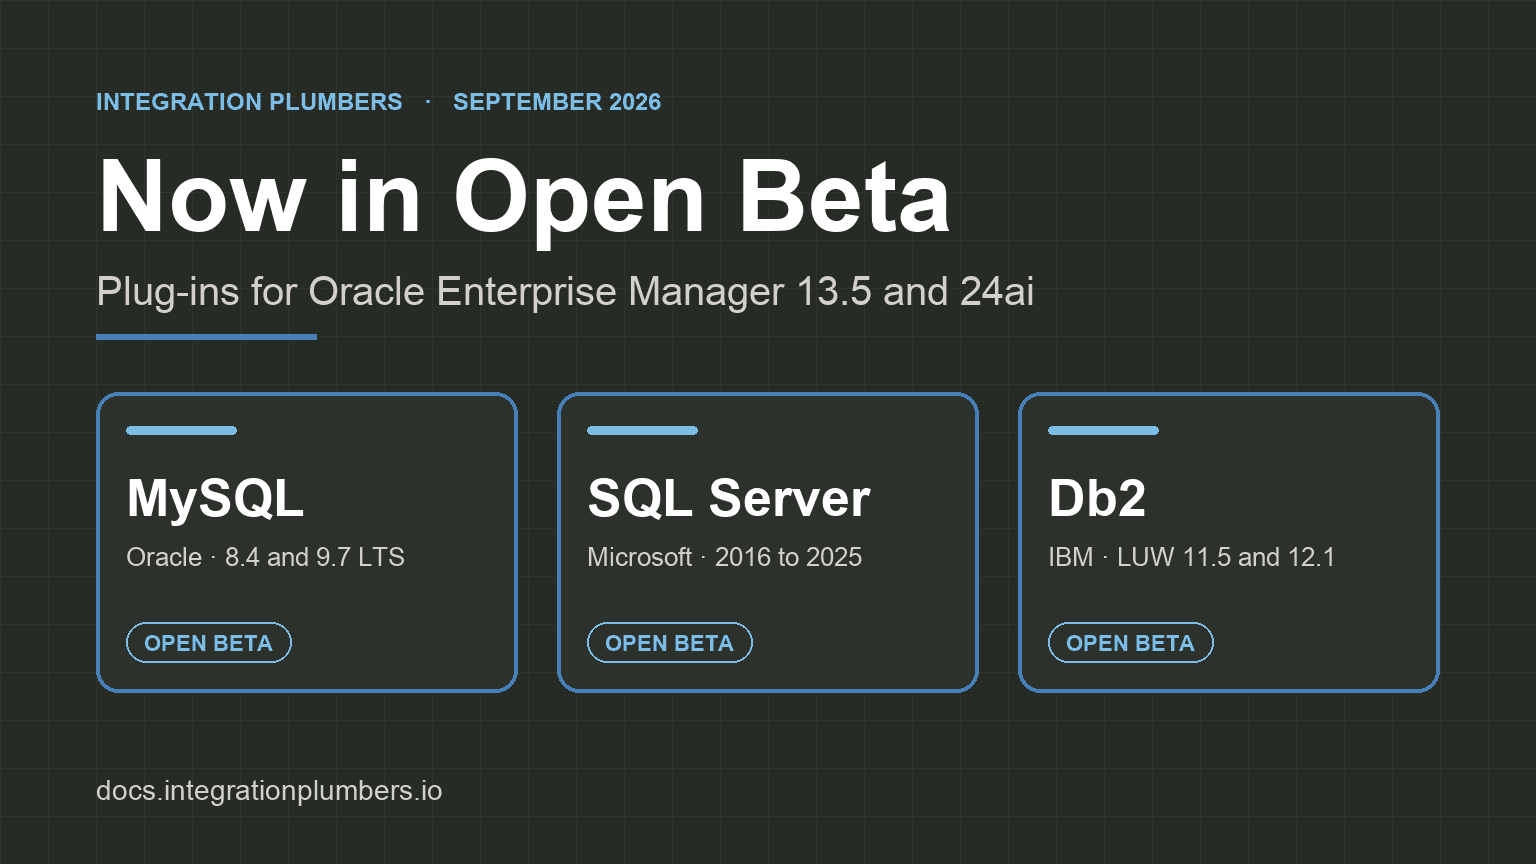
Historical query analytics is one of the capabilities arriving with our Enterprise Manager plug-ins. Open Beta opens September 2026. Want it trending your queries first? Learn more and sign up:
- MySQL Plug-in for Oracle Enterprise Manager → integrationplumbers.io/mysql-plugin
- Microsoft SQL Server Plug-in for Oracle Enterprise Manager → integrationplumbers.io/mssql-plugin
- DB2 Plug-in for Oracle Enterprise Manager → integrationplumbers.io/db2-plugin
If you would rather talk through what a trend line would show on your own workload before signing up, talk to us.
Why can't I just chart the per-query numbers my database already has?+
Because they are cumulative counters, not a series. Every one of these views hands you a single accumulated total per statement, from a starting point you did not choose: since the last server restart on MySQL, since the statement entered the package cache on Db2. Bound straight to a graph, a cumulative counter draws a line that only ever climbs, which tells you nothing about load in any particular hour. To get a trend you have to store consecutive readings and subtract them, and then handle every way that subtraction can go wrong, which is most of the actual work.
How often does the plug-in snapshot query statistics, and how many statements does it keep?+
On MySQL, every five minutes, keeping the top 25 statements per collection keyed by the performance_schema digest hash. On Db2, every fifteen minutes, keeping the top 200 per collection, keyed by a hash computed from the statement text. Those caps exist because a busy database can hold thousands of cached statements, and persisting every one on every cycle costs more storage than the answer is worth. The honest consequence is that the deep tail of your workload is not in the trend view, only the statements that made the cut each cycle.
Is the statement text stored in the Oracle Enterprise Manager repository?+
Not for the trend history. Each statement is tracked under a short stable key derived from its text, and the text itself is not persisted with the trend data. That is a deliberate design choice for this release: it keeps the storage cost of a per-statement time series proportional to the numbers rather than to your query text, and it keeps query literals out of the monitoring repository. The trade-off is stated plainly in the post: this is numeric trend history, not a searchable archive of full text and plans.
What happens when a statement gets evicted from the cache and comes back?+
It is detected and flagged rather than charted wrong. When a statement is re-cached its counters restart at zero, so a naive current-minus-previous subtraction would show a drop that never happened. The collector reads the entry's insert timestamp and compares it against a clock reading taken with the previous snapshot, both read from the database so there is no agent-versus-database clock skew to argue about. A re-cached statement is reported as a partial window instead of being quietly under-reported. There is a related trap the same check catches: on a database with more cached statements than the collector samples, one can fall below the cut for a single cycle and reappear, and reading "absent last time" as "brand new" would report hours of accumulated work as a single fifteen-minute window.
Why does the first collection show nothing?+
Because there is no previous snapshot to subtract from, so every statement would look brand new and its entire accumulated history would be reported as one window. The first collection after a fresh start, an agent restart, or an expired cache emits zero rows and records only the baseline. Normal reporting begins on the next cycle. One empty window beats one wrong window.
I'm on SQL Server. Do I need this at all?+
You already have most of it, and that is the point. Query Store retains query text, plans, and runtime statistics over a configurable window, and it has been on by default for new databases since SQL Server 2022. If you are on 2022 or later, that history is accumulating right now whether or not anything is reading it. If you are on something older, turning Query Store on is worth doing today regardless of what ends up monitoring it. What the plug-in shows on the Queries page today is live plan-cache statistics: top statements by CPU and by execution count from sys.dm_exec_query_stats, plus a rollup per execution plan. Surfacing Query Store itself, with the plan-regression analysis that comes with it, is a tracked roadmap item rather than part of the beta.
What is the difference between this and the top-SQL view I already get?+
A top-SQL view ranks what is expensive right now, out of whatever the database currently has cached. This ranks what was expensive during a window you choose, out of a stored series, which is a different question with a different answer. It is what lets you say a statement's average latency tripled on Thursday afternoon and put a timestamp on it, rather than only that it is near the top of the list this morning. Both are useful. The trend is the one that turns "has this always been like that?" into something you can answer without a slow-log expedition.
Will there ever be full query text and execution plan history?+
Yes, it is the next step on the roadmap. Keeping every statement's text and plan across history is a heavier and different storage problem from keeping its numbers, and it is being built on the same purpose-built store the PostgreSQL plug-in is pioneering. What is arriving now is the numeric trend, because that is what answers the question this post is about: is this query regressing, and when did it start.