Microsoft shipped SQL Server for Linux with SQL Server 2017, and a lot of shops took it up on the offer, mostly so the database tier could be patched and automated the same way as everything else on RHEL and Ubuntu. The instances moved to RHEL and Ubuntu, and then somebody asked how they were going to be monitored, and the answer turned out to be a Windows server.
That is the part nobody planned for. Most SQL Server monitoring grew up on Windows and still reaches for Windows to do its job: WMI for host metrics, a Windows agent to run the collection, a domain account to authenticate it. Point that design at a Linux instance and you get either nothing, or a Windows box whose only remaining job is to watch the database you moved off Windows.
The SQL Server Plug-in for Oracle Enterprise Manager takes the other route. A Linux EM agent connects to SQL Server on Linux over port 1433, collects every metric with T-SQL, and nothing anywhere in the path runs Windows.
This post has four parts: why Windows kept turning up in SQL Server monitoring, how the plug-in collects everything from inside SQL Server instead, how availability groups behave under Pacemaker, and what still works differently on Linux.
Why Windows kept turning up
Oracle has its own SQL Server plug-in for EM, and its user guide describes the model plainly. Monitoring runs "by a local or remote Windows Agent". The setup steps include setting WMI namespace security. For remote Windows authentication, the agent host has to be a member of the same Windows domain as the SQL Server host.
None of that was unreasonable when SQL Server only ran on Windows. WMI was the obvious place to read host metrics, and a Windows agent was the obvious thing to read them with. But the design carries a Windows dependency into every deployment, including the ones where the database no longer has one.
So we started from a different question: what can SQL Server tell you about itself, over a plain database connection, without asking the operating system anything?
Collecting everything from inside SQL Server
The answer is almost everything. Every one of the plug-in's 78 metric groups is collected over JDBC using T-SQL against SQL Server's catalog and dynamic management views. The Microsoft JDBC driver ships inside the plug-in, so there is nothing to install on the database server and nothing extra to install on the agent.
The agent can be Linux x86-64 or Windows x86-64, and it can run on the SQL Server host or anywhere that reaches port 1433. A Linux agent watching a Windows SQL Server is also supported, and it is how much of the plug-in was tested.
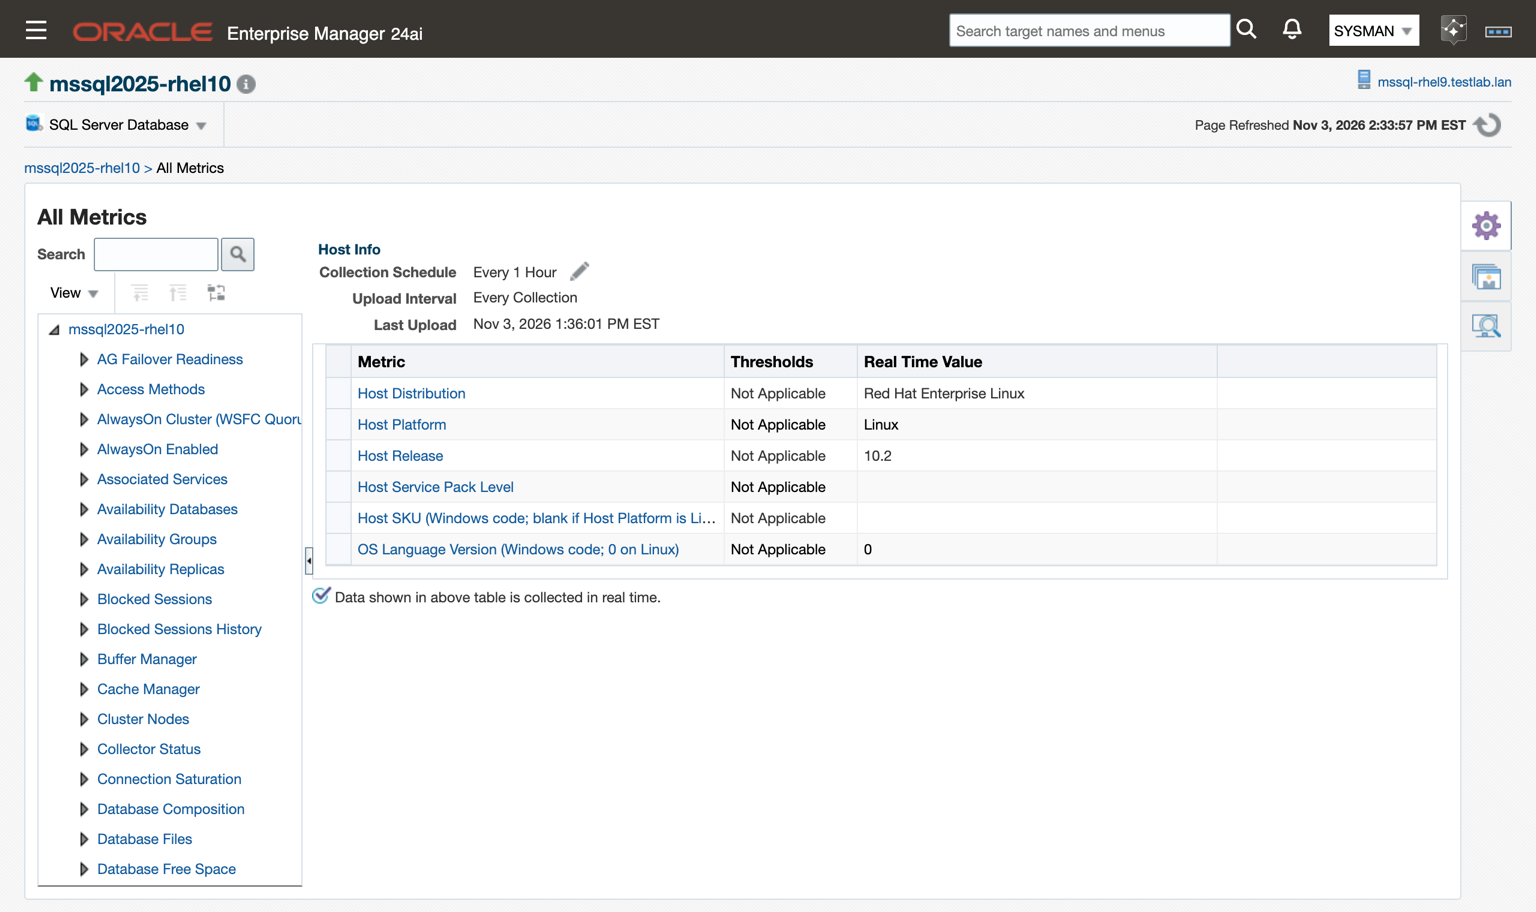
Host metrics are the hard case, because that is where Windows-based designs lean hardest on WMI. The plug-in reads them from SQL Server instead:
| Host metric | Windows WMI class | Where the plug-in reads it |
|---|---|---|
| Physical memory, total and available | Win32_OperatingSystem | sys.dm_os_sys_memory |
| CPU count and utilization | Win32_Processor | sys.dm_os_sys_info and the scheduler monitor ring buffer |
| Free space per volume | Win32_Volume | sys.dm_os_volume_stats |
| Operating system, distribution, release | Win32_OperatingSystem | sys.dm_os_host_info |
That last view does a second job. sys.dm_os_host_info reports whether the host is Windows or Linux, along with the distribution and release, and the plug-in uses it to decide which Windows-only surfaces to skip. The registry family, the Windows services list and WSFC node detail all come back as empty results on a Linux instance, not as collection errors. An empty group there means "this feature does not exist on this platform", and nothing gets paged about it.
What we certified it on
The Linux side of the certification lab covered every SQL Server version Microsoft ships for Linux:
| SQL Server | Linux host |
|---|---|
| 2017 | Oracle Linux 8, using Microsoft's RHEL 8 packages |
| 2019 | RHEL 8 |
| 2022 | RHEL 9 and Ubuntu 22.04 |
| 2025 | RHEL 10 and Ubuntu 24.04 |
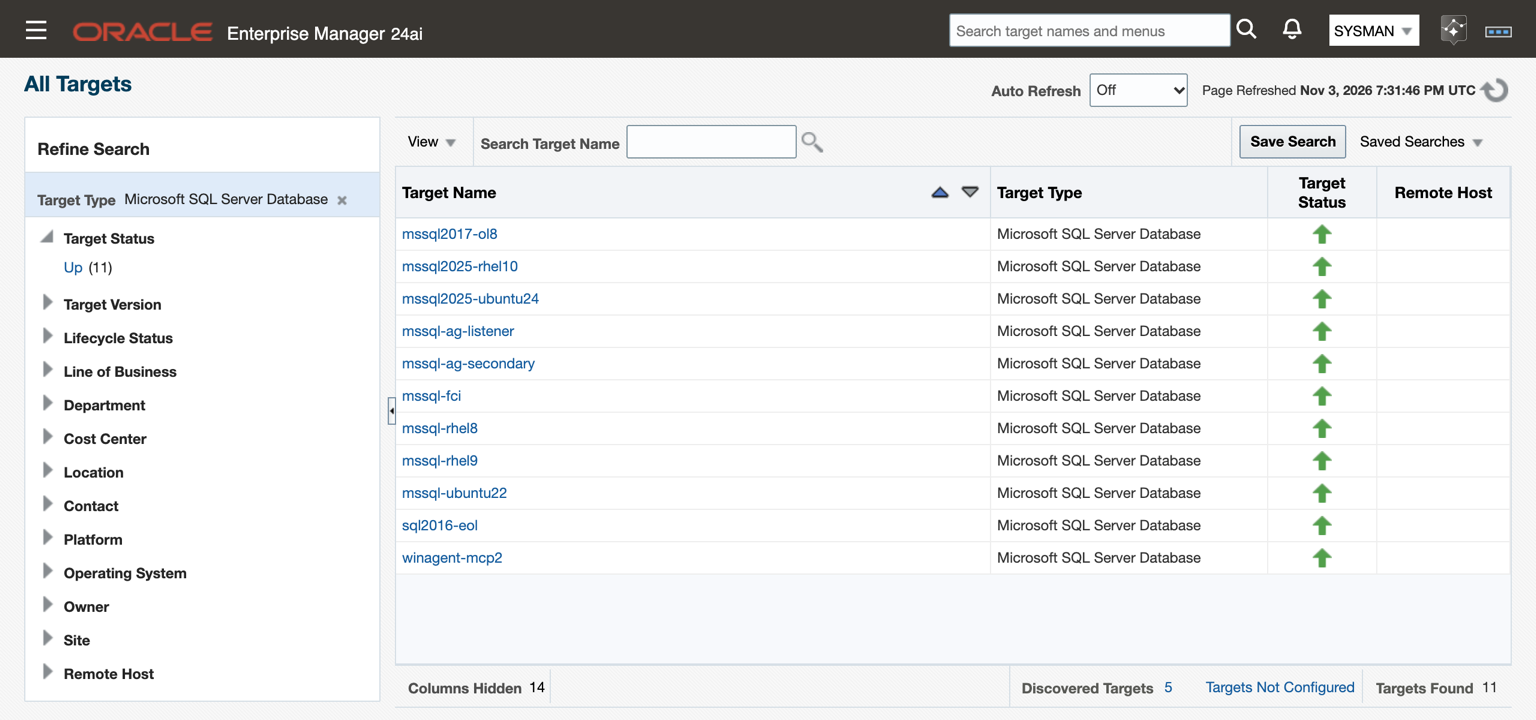
Windows instances ran alongside them, with both Linux and Windows agents, on EM 24ai and EM 13.5. The Linux instances in the lab are standalone; availability group and failover cluster testing ran on Windows. SQL Server 2016 is supported on Windows only, because Microsoft never released it for Linux.
One target type covers the lot. There is no Linux edition of the plug-in, and no separate build per SQL Server version. The same target appears in the same console with the same pages, whatever it runs on.
The monitoring login is the same everywhere too, and it is deliberately small:
-- Run once per instance, as a sysadmin. The plug-in itself never needs sysadmin.
CREATE LOGIN oem_monitor WITH PASSWORD = '<strong password>';
GRANT VIEW SERVER STATE    TO oem_monitor;
GRANT VIEW ANY DATABASE    TO oem_monitor;
GRANT VIEW ANY DEFINITION  TO oem_monitor;
GRANT CONNECT ANY DATABASE TO oem_monitor;
USE msdb;
CREATE USER oem_monitor FOR LOGIN oem_monitor;
ALTER ROLE db_datareader      ADD MEMBER oem_monitor;
ALTER ROLE SQLAgentReaderRole ADD MEMBER oem_monitor;
Every grant is read-only metadata visibility. The plug-in never calls xp_cmdshell and creates nothing on the instance. On a Linux agent it signs in with this SQL login, and the connection is encrypted by default. A verify mode checks the server certificate against a truststore you supply, with the expected host name configurable.
Availability groups and the Pacemaker boundary
High availability is where Linux and Windows differ most. On Windows an availability group sits on WSFC. On Linux it usually sits on Pacemaker, and the WSFC views that report cluster nodes have nothing to say.
The plug-in does not read availability groups from the cluster manager. Replica state, database synchronization, and the send and redo queues all come from SQL Server's HADR dynamic management views, which SQL Server provides on Linux as well as Windows. So the same AG metrics apply on a Linux availability group, and so does the AG Failover Readiness page, the one most DBAs with an availability group end up opening first.
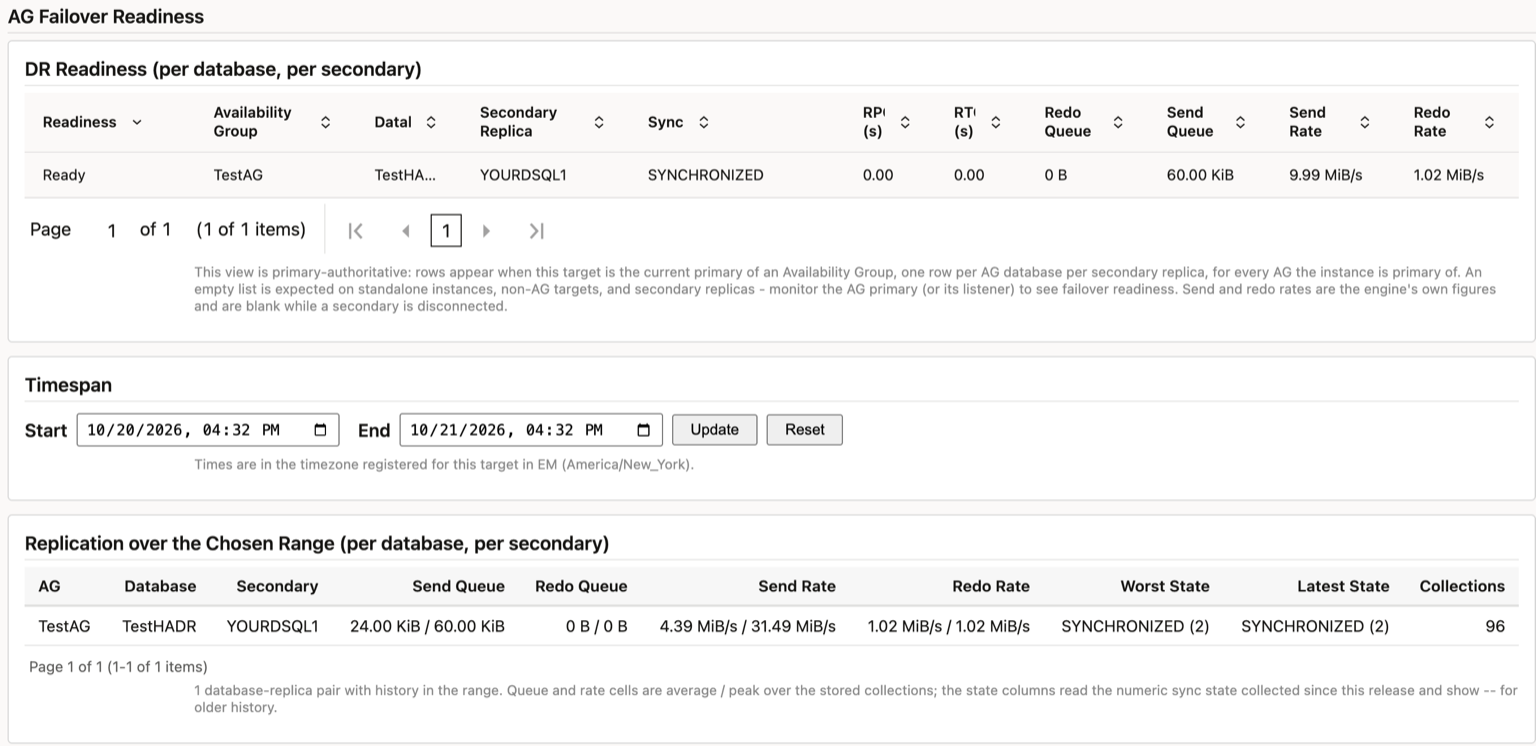
It answers the question you get asked at 2 a.m.: if we failed over right now, how much data would we lose, and how long until the secondary serves? One row per database per secondary, with the recovery point and recovery time in seconds, both queues, their drain rates, and the worst each got over the chosen range. Out of the box, the recovery point raises a warning past 300 seconds and goes critical past 900, through the same incident rules as everything else in EM.
What changes under Pacemaker is cluster node detail, because that information belongs to WSFC. SQL Server reports the availability group's cluster type as EXTERNAL, and the plug-in uses that to detect the boundary. It sets an External Cluster Boundary flag to say the instance's availability is managed by Pacemaker, and returns an empty cluster-node table instead of an error. If you monitor Linux SQL Server under Pacemaker, an empty node table is the expected result, not a fault.
What works differently on Linux
A few things do work differently on Linux, and we would rather you read about them here than find them in production.
| Area | On Linux | What to do |
|---|---|---|
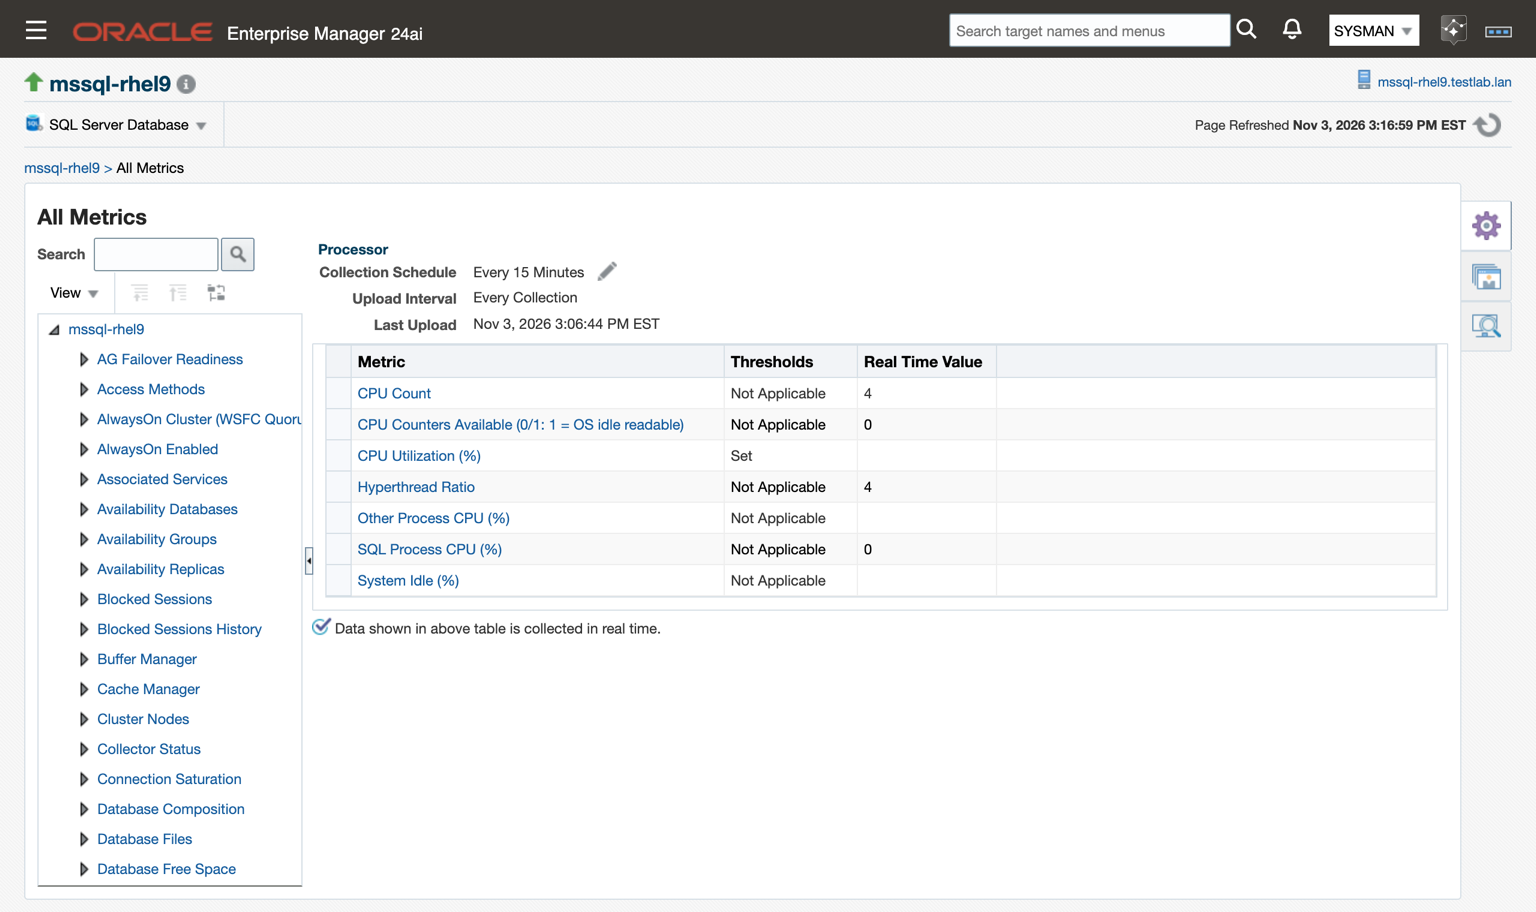
| CPU utilization, SQL Server 2017, 2019 and 2022 | The system idle figure SQL Server exposes is not usable, so the split between SQL Server, other processes and idle cannot be computed. Those columns are blank, not zero. The CPU threshold does not fire. | Read the CPU Counters Available flag. The console charts SQL Server's own process CPU instead. SQL Server 2025 on Linux reports normally. |
| Volume free space | Every volume collapses into one row holding the smallest free space. | The low-space alert still fires but cannot name the volume. Database and file space are unaffected. |
| Registry, Windows services, WSFC nodes | Empty by design. Only the SQL Server Agent appears in the services list. | Nothing. These are Windows features. |
| Authentication | SQL logins only. | Windows Integrated authentication needs a Windows agent. Kerberos is not supported yet on either platform. |
| Agent locale | Without a UTF-8 locale, non-ASCII database and object names show as question marks. | Start the agent with LANG=C.UTF-8, or add -Dfile.encoding=UTF-8 to agentJavaDefines in emd.properties. |
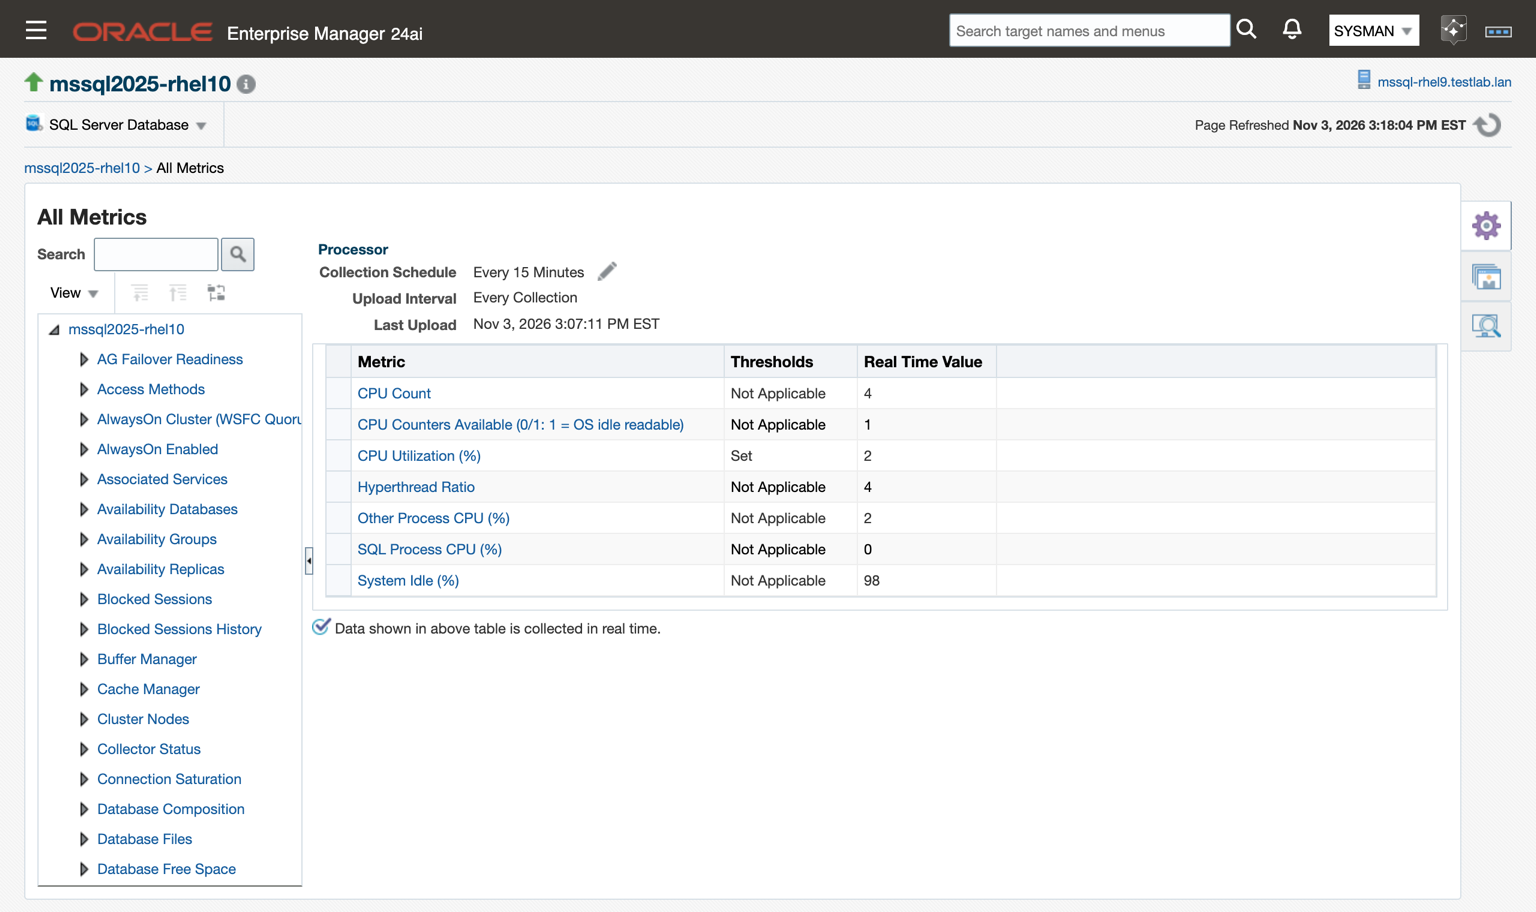
The CPU row is the one worth understanding. On those three versions the figure SQL Server reports for system idle is not real, and a monitor that charted it anyway would show a host that looks busy or idle for reasons unrelated to its load. A blank column is less satisfying than a chart full of numbers, but it does not mislead anyone, and the flag lets a script or an AI client tell the difference. One edge case to know: a host that genuinely sits at 100% CPU reads the same way, because the two cannot be told apart at the source.
The Processor metric shows the difference. On SQL Server 2022 on RHEL 9, CPU Counters Available reads 0 and the system columns are blank:
On SQL Server 2025 on RHEL 10, the flag reads 1 and every column reports:
For the locale, check a running agent before you chase missing characters:
# On the agent host: what locale did the agent start with?
tr '\0' '\n' < /proc/<agent pid>/environ | grep LANG
Everything else you would look at on a Windows instance, you look at in the same place on Linux.
Do I need a Windows server anywhere to use this?+
No. The EM agent can run on Linux, it reaches SQL Server over port 1433, and it collects everything through T-SQL. The only reason to involve Windows is if you want Windows Integrated authentication, which needs a Windows agent.
Does the agent have to run on the SQL Server host?+
No. The agent can be local or remote. Remote monitoring from a Linux agent is a common arrangement and how much of the plug-in was certified.
Which Linux distributions are supported?+
The plug-in reads SQL Server through T-SQL, so it follows Microsoft's support for SQL Server on Linux rather than adding its own list. The certification lab ran Oracle Linux 8, RHEL 8, 9 and 10, and Ubuntu 22.04 and 24.04.
Why is CPU utilization blank on my Linux instance?+
On SQL Server 2017, 2019 and 2022 on Linux, the system idle figure SQL Server reports is not usable, so the plug-in leaves the utilization columns blank instead of reporting a misleading number. SQL Server's own process CPU is still charted. SQL Server 2025 on Linux reports normally.
Does it work with availability groups managed by Pacemaker?+
Yes. The plug-in reads availability groups, including AG Failover Readiness and its recovery point thresholds, from SQL Server's HADR views, which are the same on Linux. Only WSFC cluster node detail is absent, and it is reported as empty rather than as an error.
Can I use Kerberos or Active Directory authentication from a Linux agent?+
Not today. A Linux agent uses a SQL login. Windows Integrated authentication works from a Windows agent, and Kerberos is not supported on either platform yet.
We already run Oracle's SQL Server plug-in. Do we have to switch everything at once?+
No. Both plug-ins can monitor the same instance at the same time. Add your Linux instances to this one, run the two side by side, and retire the old targets when you are ready. Thresholds do not carry over, so plan to set those again.
Does it support Azure SQL Database, Managed Instance or Amazon RDS?+
No. It monitors self-managed SQL Server 2016 through 2025 on Windows, and 2017 through 2025 on Linux.
Where this fits
The SQL Server Plug-in for Oracle Enterprise Manager reached general availability on October 23, 2026, as two builds with the same features: 24.1.1.0.0 for Enterprise Manager 24ai and 13.5.1.0.0 for Enterprise Manager 13.5. Linux support is part of the same plug-in, collecting the same way on either platform, so a mixed estate is one target type rather than two tools.
Linux is one part of it. The same release adds deadlock capture with no trace flags or Extended Events sessions to set up, TempDB contention classification, Query Store plan-change detection, 14 compliance rules and T-SQL jobs for backup, restore and index work, and on EM 24ai RU12 and later, EM's own MCP server can read every metric group with nothing to enable on our side.
If you are moving SQL Server off Windows, start with the prerequisites page for the grant list and agent requirements, and write to helpdesk@integrationplumbers.io for a license key. The download comes with it.